Intraocular lens (IOL) power calculation is probably not one of the most attractive topics in ophthalmology. As a consequence, the results from the optical biometry device are often trusted blindly. However, every cataract surgeon should be aware of the fact that the calculation of the accurate IOL power is crucial for the post-operative patient satisfaction. Even with modern measurement techniques, such as optical biometry1 and using the latest generation of IOL power calculation formulae, there is a relevant unpredictability of the post-operative manifest refractive outcome.
Approximately 20 % of patients, depending on their axial length, require a refractive correction of more than ±0.5 diopter (D) spherical equivalent post-operatively.2 However, in short eyes this percentage increases to 30 % to 40 % in eyes below 22.0 mm, or above 26.0 mm of axial eye length (AL).
These refractive surprises result in poor unaided visual acuity and a reduced patient satisfaction.
This problem becomes more and more relevant as patients’ expectations are rising. Whereas for first IOL implantations some decades ago only one IOL power was available to restore better postoperative corrections compared with aphakia, today patients often want to be completely spectacle independent for distance vision or even at all distances. For a patient with an AL of 20.5 mm who wants a multifocal IOL, the chance of a refractive surprise of more than 1.0 D is approximately 20–30 %.
Why Do We have Refractive Surprises after
Cataract Surgery?
Norrby3 investigated the error distribution of different factors on the postoperative manifest refraction. Many different parameters were shown to have an influence, such as AL, corneal anterior apical radius (mm) and corneal posterior/anterior radius ratio, corneal anterior and posterior asphericity, corneal thickness and the refractive indices of aqueous and vitreous, as well as pupil size (mm), the error of the post-operative manifest subjective refraction and, most importantly, the prediction of the post-operative anterior chamber depth (ACD). Since the introduction of optical biometry4 (IOLMaster, Carl Zeiss Meditec AG, Jena, Germany), which was shown to be a reliable, operator-independent,5 non-contact measurement of AL, measurements became much more accurate. Relatively new software algorithms allow the use of a composite scan, which means that several scans are averaged to improve the signalto- noise ratio. This software improvement led to a better success rate in dense cataracts, especially dense posterior subcapsular cataracts.6 New technologies, such as swept source optical coherence tomography (OCT) imaging of the entire eye, use an additional fixation check to assure measurement of the patient’s visual axis.
However, two factors still have a significant impact on the post-operative refractive error, namely the prediction of the post-operative IOL position and the post-operative refraction itself. The latter is probably difficult to understand, because it basically means that the outcome (post-operative manifest refraction) is a source of error, but this can be explained due to the weak reproducibility of subjective refraction.3 Not taking this factor into account, the error in the prediction of the post-operative IOL position has by far the most relevant impact on the refractive outcome.
Which Eyes have a Higher Likelihood of a
Refractive Surprise?
IOL power calculation is especially difficult for short and long eyes.2 In short eyes this error is even more relevant, as short eyes usually need a high IOL power; therefore, the prediction of the position is even more important. By contrast, long eyes usually receive low-powered IOLs. Additionally, patients who underwent refractive treatment of the cornea are at risk of an unexpected post-operative refraction.
How did Modern Intraocular Lens Power
Calculation Develop?
The first theoretical IOL power calculation formulae, such as the Gernet, Ostholt, Werner 1970 (GOW70),7 focused only on optical principles. Although these formulae were correct, they were not feasible for several reasons, the main one being that the post-operative IOL position was included as a known parameter. Due to the fact that this was not the case, the post-operative IOL position was assumed to be a constant factor. However, neglecting the fact that the eye is a thick lens system the theoretical formulae are correct and they derive from the following calculation: the vergence is equal to the medium’s refractive index divided by the distance between the vergence plane to the focal point in meters. If a lens is added to this system the power of this lens in diopters simply has to be added.
A couple of years later, Fyodorov et al.8 changed the formula slightly. Although their formula was in principle similar to the GOW70 formula, they also mentioned the necessity to develop a model to predict the final post-operative IOL position. It should be added that typical IOLs at that time were iris fixated. Two factors were considered to be relevant, the corneal radii in mm, and what they called the internal diameter of the cornea. This internal diameter was defined as the white-to-white (WTW) distance plus 1.0 mm. The final IOL position was then predicted using a regression model deriving from collected patient data. Therefore, this formula was a mixed formula using a theoretical core and a regressionbased prediction of the post-operative IOL position.
In the following years the idea to predict the post-operative IOL position only using empirically derived data in a regression model became common. These models were based on a best-fit statistic – without taking optical laws into account.
But how does regression work? An example: how could the AL (in mm) and the corneal radii (in mm) be used to predict the post-operative manifest refraction (in diopters)? Let us assume these three parameters would be available for 100 patients. In the next step one can create a (multiple linear) regression model for every patient (see Formula 1).
P = x*AL + y* K + A
Formula 1
So the power of the IOL is equal to the AL times a weighting factor (i.e. AL*0.3) plus/minus the keratometry times a weighting factor. Furthermore, regression always requires a constant ‘A’ (this constant compensates for the off-set from the origin). So the aim of a regression model is to create a stable model that can be used in patients outside the 100 patients it was derived from, but the A-constant has to be separately optimised for different types of IOLs. If we are a little more critical, we have to admit that it is ‘fudging’, because we have a deviation between the aimed and the measured outcome and correct for it by changing a virtual factor, namely the constant without knowing, where the error derives from.
One of the best-known regression IOL power calculation formulae was developed by Sanders, Retzlaff and Kraff (SRK I).9 This formula was shown to result in refractive surprises especially in short and long eyes. Sanders, Retzlaff and Kraff tried to incorporate this phenomenon in their SRK II formula by adjusting the A-constant depending on the AL (where the A-constant was changed for short and long eyes).10 However, neither the SRK I nor the SRK II should be used any more as it was shown that their performance is weak. This should not be confused with the SRK/T formula, one of the first modern IOL power calculation formulae, which is still in use and comparable with other modern formulae.
Modern Intraocular Lens Power
Calculation Formulae
More recently developed IOL power calculation formulae are called ‘theoretical formulae’ that rely on regression equations. The main difference of all modern IOL power calculation formulae is the number and weighting of explanatory variables to predict the effective lens position. One factor these formulae have in common is that the real (anatomical) IOL position is no longer the value to be predicted, but a virtual non-measureable factor, called effective lens position (ELP). This is the effective distance from the anterior surface of the cornea to the lens plane as if the lens were infinitely thin.11
One of the first approaches by Fyodorov et al.8 to use the WTW and the corneal radii as prediction factors was not confirmed by other authors, but in fact there was (and is) still no agreement of which factors should be used to predict the ELP. Hoffer (Hoffer Q formula)12 and Holladay (Holladay I formula)13 included AL and corneal power measurements in their IOL power calculation. Both authors have adjusted their formulae over time using other factors, such as pre-operatively measured ACD and pre-operatively measured refraction. Olsen14 used a combination of the ACD and the thickness of the lens for the same purpose using another term for his ELP prediction constant ‘C’, including the regression behind the constant C. The thickness of the crystalline lens as a predictor for the post-operative IOL position was discussed controversially in the literature. Olsen14 incorporates the lens thickness in his IOL power calculation formula and Norrby used the lens thickness as a predictor for the lens haptic plane (LHP).15
Haigis16 also uses a thin lens formula based on the GOW70, but predicts the ELP in a slightly different way compared with other conventional IOL power calculation formulae. Whereas others include only one constant, Haigis introduced a system including three different constants, one general constant and two constants that weight the effect of the pre-operatively measured ACD and AL, respectively (see Formula 2).
d = a0 + a1ACD + a2AL
Formula 2
ELP prediction for the Haigis formula
d = effective lens position
a0 = main constant
a1 = second constant (used as a weighting factor for pre-operative ACD)
a2 = third constant (used as a weighting factor for axial eye length)
Another option is to calculate IOL power for emmetropia with ray tracing, which uses numerical solutions, and was shown to be beneficial for IOL power calculation in eyes after refractive surgery, but was not shown to be superior in predicting the post-operative position of the IOL.17 However, ray tracing does not solve the problem of predicating post-op IOL position – this needs to be performed with a separate algorithm and is then used in the ray tracing method.
What are the Potential Problems of
these Formulae?
As mentioned above, AL measurements are no longer a relevant source of error. Unpublished data by Norrby showed that the error distribution of the AL measurements is below 5 % of the entire post-operative refraction error.
Another source of error is the cornea. In addition to measurement errors, an error derives from the fact that the cornea is dealt with as a thin lens (although it is a thick lens). Therefore, the corneal power results from its radii and a refractive index, but factors such as corneal thickness or a difference between the anterior and posterior surface are not taken into account. Furthermore, the refractive index varies from study to study. Whereas the Gullstrand eye would suggest a refractive index of 1.3375, Olsen18 uses a lower refractive index of 1.3315. Dubbelman19,20 confirmed a lower RI. However, in the same study the influence of Zernike Z4,0 (spherical aberration) on the corneal power was assessed. If the effect of asphericity of the cornea was taken into account, the Dubbelman model was very similar to the ‘old’ Gullstrand model concerning corneal ‘power’. This matter was further discussed by Liou and Brennan.21 In their model the corneal power was calculated as a simplified (nonastigmatic) conicoid (aspheric) shape (see Formula 3).
x2 + y2 + (1 +Q)*z2 – 2zR = 0
Formula 3
Aspheric non-astigmatic thin lens formula for the corneal power
x = horizontal meridian
y = vertical meridian
z = axis of revolution
R = radius of the apex
Q = asphericity parameter
Olsen et al.11 showed an approach to assess the cornea as a thick lens. This formula in combination with the Liou and Brennan model results in a more realistic model of the cornea. To develop an eye model consisting of two thick (non-astigmatic) lenses another parameter has to be known: the thickness (and the curvature) of the IOL. These parameters are not distributed by the companies and, therefore, it is difficult, to take them into account.
Another problem is the concept of using simple regression formulae. Simple regression formulae, such as multiple linear regression, strictly require an independence of the explanatory variables. But this is not the case for different factors, i.e. AL and ACD. Another problem is the problem of over-fitting. This means that an increase of the number of explanatory variables will lead to a better prediction model for the sample, but not necessarily for the population outside the tested sample. In other words, a regression model is not necessarily better just because it contains more explanatory variables.
A Novel Prediction Concept for the Intraocular
Lens Position
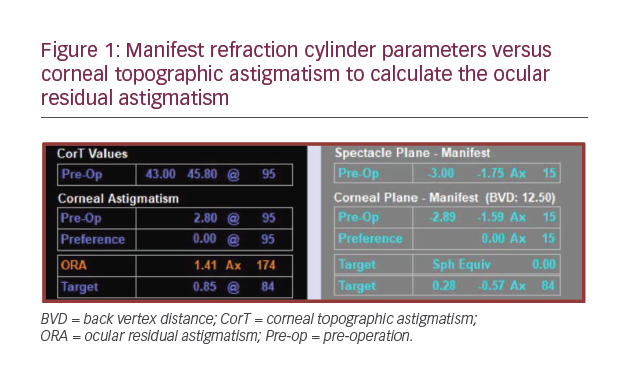
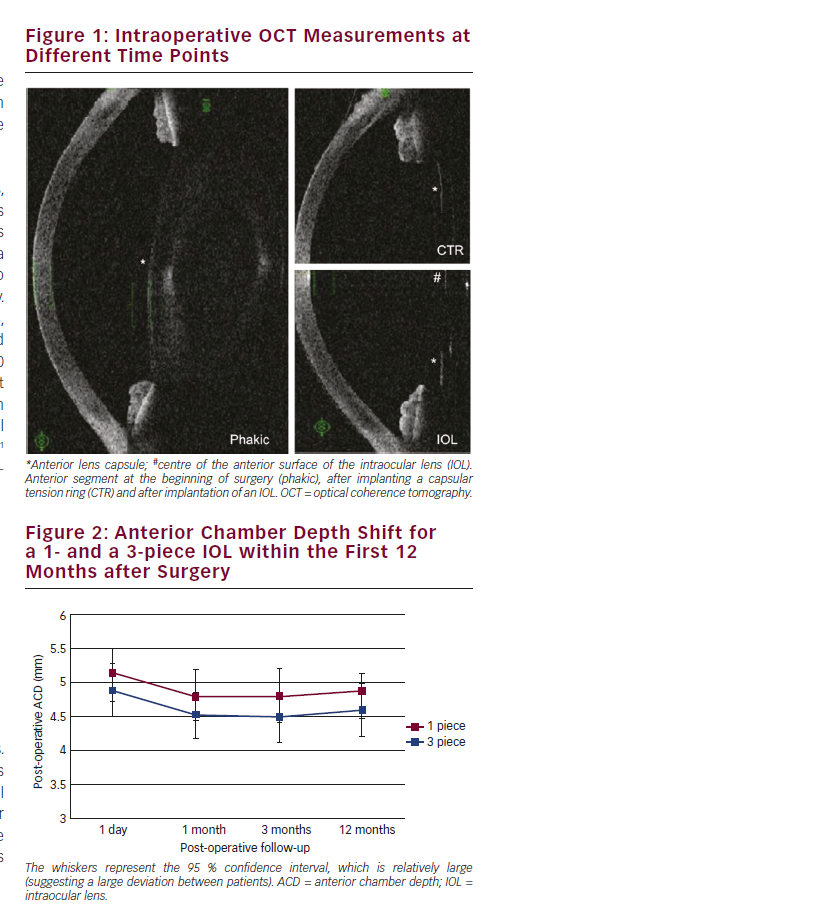
As shown by Norrby,3 the main source of error in IOL power calculation is the prediction of the post-operative position of the IOL. A recently developed concept includes intraoperative ACD measurements of the anterior lens capsule of the aphakic eye using a continuous anterior segment OCT (see Figure 1) and a sophisticated statistical modelling technique. In short, an intraoperative OCT scan is performed after the crystalline lens is removed. After the eye pressure of the aphakic eye is held constant at about 20 mmHg using an irrigating canula through a paracentesis, the distance between the anterior lens capsule and the cornea is measured. This intraoperatively measured distance is then used to predict the post-operative position of the IOL.22,23
Intraoperative measurements of the anterior lens capsule under standardised conditions and using a capsular tension ring to result in a taut capsule during the measurement lead to a significantly better prediction of the post-operative IOL position compared with conventional IOL power calculation formulae.22,23 Whereas all conventional IOL power calculation formulae use pre-operatively measured factors, such as corneal radii, AL and others for the prediction of a virtual non-measureable effective lens position, there are only a few papers dealing with the prediction of the real ‘anatomical’ IOL position. One of the first papers was published by Naeser et al.24 using the pre-operative posterior lens capsule as a predictor for the postoperative IOL position. Although the aim of Naeser et al. was to find a more ‘anatomical’ way of predicting the post-operative IOL position,
the authors ended up with an empirical (regression) model. In their model three parameters were found to be good predictors: age, preoperative ACD and AL. Lens thickness was found to have almost no influence (r = –0.002; p=0.99). Naeser et al. discussed two reasons for this fact: first, they mentioned ‘intercorrelation’ (colinearity) of the data. This is the case for lens thickness and age, but also for ACD (inversely). Second, the zonules could be weaker in the elderly population resulting in a more posterior position of the posterior lens capsule resulting in a deeper ACD. Although their publication resulted in an empirical model comparable with other conventional IOL power calculation formulae, the concept was interesting and further developed by Norrby et al.25,26 His LHP concept was defined as: “For normal looped lenses, the LHP can be depicted as the plane through the vertices of the loops”25 – which is very close to the equator of the lens. This definition fits very well with the intraoperative measurements of the anterior lens capsule. At the time of the introduction of the LHP concept, the measurement of this position was not possible, therefore, the LHP was estimated.
Intraoperative OCT scans of the anterior lens capsule of the aphakic eye allow measurements of a position close to the theoretical LHP. Although the LHP explains the position of the haptics, the position of the optics cannot be predicted directly. The distance between the LHP and the anterior IOL surface is the so-called compressed vault height. This factor is influenced by the balance of forces of the tissue of the eye (especially the post-operative shrinkage of the lens capsule) and the IOL haptics.15
One remaining problem is the variable intraoperative hydration of the vitreous. In the case of significant vitreous hydration the anterior chamber is artificially shallow. Within the first hours, or days after surgery, this hydration disappears resulting in a deviation between the intraoperatively measured ACD and the post-operatively measured ACD.
The novel intraoperative IOL prediction method was shown to be superior compared with pre-operative measurement methods. This superiority was strongest immediately after surgery and decreased slightly within the first post-operative weeks. The reason for the decline is that the novel method improves the prediction of the IOL in the capsular bag, but does not improve the prediction of the ACD shift after cataract surgery due to the compressed vault height. Plate-haptic designed IOLs were found to shift backwards slightly more compared with open loop haptic IOLs.27 These findings were confirmed by another plate haptic IOL.28 Similar findings were observed when comparing ACD changes of 1- and 3-piece IOLs (see Figure 2).29
Summary
IOL power calculation improved significantly during the last decades, but the main problem, namely predicting the post-operative IOL position, is still not completely solved in modern IOL power calculation formulae. To date it was not possible to prove one modern IOL power calculation formula to be superior to others, but old formulae, such as the SRK II should not be used anymore, as they were proved to be inferior. To improve the refractive outcome a surgeon should optimise the constants of the formulae of his/her choice and to compare different formulae, especially in short and long eyes. One promising novel approach is to measure the lens capsule of the aphakic eye during cataract surgery using OCT to predict the post-operative IOL position, but this approach is not yet commercially available.