Contrast sensitivity (CS), which is an important element of functional vision, helps in differentiating an object from its background. CS affects several aspects of vision, such as acuity, dark adaptation, visual field, motion detection and pattern recognition.1 A decline in spatial CS occurs in several ophthalmic disorders, including cataract, glaucoma, diabetic retinopathy and age-related macular degeneration.
Commonly, CS tests measure central contrast, as they traditionally use paper charts and cards (e.g. Pelli-Robson [PR] chart, Mars Letter Contrast Sensitivity Test, Regan low-contrast letter acuity charts, Vistech VCTS 6500 charts and Hamilton–Veale CS card test). The drawbacks with chart-based tests are that they can easily be memorized due to pattern recognition, are vulnerable to reflections from the surface, have uneven illumination, are prone to fading of print and provide information only on central CS.2
The Spaeth/Richman Contrast Sensitivity (SPARCS) test is an internet-based low-cost test (developed by Dr George Spaeth, patent no. 8042946) that measures CS in both central and peripheral vision, independent of optotypes with global accessibility.3 In this short article, we will discuss CS pathways, techniques of assessing CS using SPARCS and its practical applications in clinical practice.
Contrast sensitivity pathways
In the visual system, CS is mediated by two main cellular pathways: the magnocellular (MC) and parvocellular (PC) pathways. The MC pathway has a high contrast gain, implying that the pathway is highly sensitive to changes in contrast, making it capable of detecting even small differences in luminance. However, this sensitivity has a limitation, and the pathway can become saturated or maxed out in its response at lower levels of contrast compared with other visual pathways. On the other hand, in the PC pathway, as the contrast in a visual stimulus increases, the neural response of the PC pathway increases in a fairly linear manner.4 This characteristic results in a graded and detailed representation of contrast differences. The MC pathway can be important for tasks, such as detecting motion or low-contrast objects, but it may not be as effective for distinguishing fine details in high-contrast scenes where other visual pathways, such as the PC pathway, may excel.4 The detection and discrimination of short, achromatic patterns of low contrast are processed by the MC pathway, while the PC pathway is involved in the mediation of visual resolution and chromatic processing.
McKendrick et al. have shown that the low-spatial-frequency-sensitive channels of both MC and PC pathways, which are mediated by cells with larger receptive fields, are almost equivalently impaired in early glaucoma.5
Spaeth/Richman Contrast Sensitivity test
The use of the SPARCS test requires a standard computer with a display monitor set to a resolution of 1,024×768, 256 grey levels and a screen size of at least 22 cm width and 26.5 cm height. The test requires internet access and is available via their website.6 Every patient gets a unique identification number after registration on this platform. This facilitates data management and follow-up testing. All patients are provided instructions on how to perform the test; this also includes the demonstration of the actual procedure. The examination display spans 30° horizontally and 23.5° vertically when viewed from 50 cm. The central region is about 5° across and 3.5° vertically. The patient is instructed to lock their gaze on this central region and spot any differences in the surrounding regions. Once ready, they click on the central area to start the test. Striped patterns (gratings) with a rate of 0.4 lines for every degree briefly emerge in one of the five zones for 0.3 seconds. After spotting the pattern, patients shift their focus momentarily to choose the testing area. After that, they refocus on the central region and tap to proceed to the next image. The region where the gratings appear is random, and responses are monitored by the software till it determines the CS in each area. The process is usually completed within 5–10 minutes for each eye.
The threshold for contrast is ascertained through a stepwise method using a staircase strategy with reversals.7 Initially, accurate answers move the test up four stages until a mistake occurs. Following an error, the test eases by two stages. After that, it either steps up or down incrementally until there are two consecutive mistakes at a certain stage, marking the threshold. If patients repeatedly tap the same area without attempting to identify the pattern, the test stops and advises them to try locating the gratings. The test examines contrast levels between 100 and 0.45% (log CS range: 0.00–2.35), with an average decrease of 0.15 log units between steps. The Weber contrast formula is used to compute the contrast value. Scores are assigned individually to the central area and the four outer areas. The cumulative SPARCS score is the sum of all five areas, with 100 being the highest possible combined score.7
Normative database
CS involves both optical and neurological processing and declines with increasing age. Gupta et al. have documented the normative values of SPARCS in the Caucasian population. The total SPARCS scores ranged from 86.37 (±1.09) for the young (20–29 years age group) to 70.71 (±2.64) for the elderly (80–87 years age group) population.8 Bariya et al. documented a normative database for the Asian Indian population. They also found a statistically significant decline in average SPARCS scores as age increases. In their study, SPARCS scores ranged from 86.68 (20–29 years age group) to 67.44 (70–79 years age group).9 It has also been shown that CS scores remain stable in patients with different types of refractive errors when they are wearing their routine prescription glasses or contact lenses.10
Applications of contrast sensitivity assessment
Cataract
Depending on its density and subtype, cataract causes a variable reduction in CS Table 1.7–27,30 The study by Bernth-Petersen has shown that nearly one-fifth (20%) of individuals with cataract and a relatively good visual acuity (VA) report a significant visual disability.31 The difference might arise because Snellen VA evaluates primarily high spatial frequencies, whereas the functional issues might stem from diminished low-spatial-frequency CS. Low-spatial-frequency CS can better reflect the impact of wide-angle scattering and forward light scattering on cataracts. However, while both the PR chart test and SPARCS are low-spatial-frequency CS tests, SPARCS is more adept at identifying a decline in CS with an increasing cataract severity. Gupta et al. have shown that in patients with nuclear sclerosis grade 2+ or 3+ (Lens Opacity Classification System [LOCS]), SPARCS can detect a statistically significant reduction in CS when compared with non-cataractous controls, unlike the PR chart test that could detect CS differences only when nuclear sclerosis grade was 3+ or more.25
Table 1: Summary of studies using Spaeth/Richman Contrast Sensitivity test
|
Year |
Study |
Condition |
Purpose |
Sample size |
Design |
Main results |
|
2023 |
Ichhpujani et al.11 |
POAG |
CS changes post travoprost 0.004% |
33 patients (62 eyes) |
6-month follow-up |
Total SPARCS CS score improved from 69 ± 10.99 to 74.62 ± 9.50; SPARCS CS scores were correlated with VF indices and OCT |
|
2022 |
Bariya et al.9 |
Normative database |
Normative database in the Indian population |
200 patients (400 eyes) |
Cross-sectional |
Total SPARCS CS scores decreased with age; the mean binocular SPARCS scores at 20–29 years were 86.51 ± 5.18 and at 70–79 years were 75.36 ± 8.99; the test duration increased with age |
|
2022 |
Rehman et al.12 |
IIH |
CS changes in IIH |
10 patients (20 eyes) |
15- to 24-month follow-up |
CS and OCT may be potential indicators to identify the recurrence of IIH |
|
2022 |
Ichhpujani et al.13 |
LPI in the angle-closure disease spectrum |
CS changes post LPI |
30 patients (30 eyes) |
3-month follow-up |
LPI does not affect the SPARCS CS score in patients with PACD |
|
2022 |
Tsiogka et al.14 |
Refractive surgery techniques |
CS changes post PRK or FSLASIK |
93 patients (186 eyes) and 31 patients per group |
Retrospective |
Refractive surgery, especially PRK decreases the SPARCS CS score |
|
2021 |
Singla et al.15 |
HCQS toxicity |
CS changes post HCQS |
10 patients (20 eyes) |
6-month follow-up |
SPARCS CS scores decrease post HCQS and may be a potential indicator to identify the toxicity |
|
2020 |
Ichhpujani et al.16 |
POAG progression |
CS changes in severe POAG |
15 patients (30 eyes) |
24-month follow-up |
SPARCS CS scores may be used along with MD to monitor the glaucoma progression; over the 24-month period, MD changed by 9.46 ± 12.73%, PSD by 0.64 ± 14.03% and average SPARCS by 3.31 ± 12.73%; while SPARCS and MD show a high internal correlation, PSD has a poor correlation |
|
2020 |
Rao et al.17 |
Glaucoma staging |
CS changes in glaucoma |
47 patients (50 eyes) |
Retrospective |
Total SPARCS CS scores can predict a change in MD (β=0.5, p<0.001, R2=61.8%), with a minimal association of other quadrants or PR scores and may have potential utility in staging glaucoma severity |
|
2020 |
Rehman et al.18 |
IIH |
CS changes post IIH treatment |
10 patients (20 eyes) |
3-month follow-up |
SPARCS CS scores increase post-treatment in patients with IIH; the average SPARCS scores pre-treatment, at 1-month post-treatment and at 3-month post-treatment were 68.8 + 10.16, 74.45 + 11.17 and 75.7 + 10.81, respectively |
|
2020 |
Marino et al.19 |
POAG |
CS changes post citicoline, homotaurine and vitamin E supplementation |
44 patients in Group 1 (current Rx first) and 65 patients in Group 2 (supplementation first) |
8-month follow-up with a randomized cross-over design (4-month current Rx and 4-month supplementation) |
SPARCS CS and GQL-15 findings improve in patients treated with citicoline, homotaurine and vitamin E supplementation |
|
2019 |
Reighard et al.20 |
Glaucoma |
Validation of CAARV in Indian patients with glaucoma |
145 patients |
Cross-sectional |
Rasch-calibrated scores on the I-CAARV were significantly correlated with Rasch-calibrated IND-VFQ scores (r=-0.54) and with MD, presenting VA, best-corrected VA and SPARCS CS scores in both the better-seeing eye (r=0.60, -0.51, -0.53 and 0.76, respectively) and the worse-seeing eye (r=0.48, -0.61, -0.46 and 0.69, respectively) |
|
2019 |
Eshraghi et al.21 |
Glaucoma |
CS and ADL/QOL in POAG, PACG and PXG |
161 patients (322 eyes) |
Cross-sectional |
SPARCS CS scores were correlated with VF, CAARV and NEIVFQ-25 |
|
2019 |
Waisbourd et al.22 |
Glaucoma |
CS in rapid progression (MD loss >2.0 dB/year) |
22 patients out of 153 patients |
Longitudinal |
SPARCS CS scores show a significant reduction in rapid progressors |
|
2019 |
Gupta et al.8 |
Normative database |
Normative database |
205 patients |
Cross-sectional |
Total SPARCS scores range at 20–29 years: 86.37 ± 1.09 and at 80–89 years: 70.71 ± 2.64; SPARCS scores decline with an advanced age and an increased cataract severity (p<0.0001) |
|
2018 |
Thakur et al.23 |
Glaucoma |
SPARCS across varying severity of glaucoma |
135 patients (135 eyes) |
Cross-sectional |
ICCs for PR were 0.952 and 0.988 for SPARCS; COR for the mean SPARCS score was 5.65%, while COR for PR was 12.44%; PR had a sensitivity of 80% and a specificity of 65.6% for detecting patients with glaucoma as compared with 84.4 and 70% for SPARCS |
|
2017 |
Amanullah et al.24 |
Glaucoma |
CS and RNFL correlation |
161 patients |
4-year follow-up |
SPARCS score in the left upper area was correlated with inferior RNFL |
|
2017 |
Gupta et al.25 |
Cataract |
CS in normal controls and patients with cataract |
84 patients (162 eyes); 23 cataract patients (43 eyes) and 61 controls (119 eyes) |
Cross-sectional |
There is a significant influence of cataract on CS; the SPARCS mean scores centrally were 13.4 and 14.5 in the cataract and control groups (p=0.001) |
|
2016 |
Sun et al.10 |
Refractive errors |
CS in myopes, emmetropes and hyperopes |
93 patients (182 eyes) |
Cross-sectional |
There is no difference in CS among myopes, emmetropes and hyperopes wearing their habitual correction |
|
2015 |
Ekici et al.26 |
Glaucoma |
Clinical visual assessments and both a vision-related performance (CAARV) and two QOL instruments (NEIVFQ25 and MGSS) |
161 patients |
4-year follow-up |
CS and MD were correlated highly with CAARV and QOL |
|
2015 |
Waisbourd et al.27 |
Glaucoma |
Study design |
161 patients |
4-year follow-up |
Study design for the studies reported earlier28,29 |
|
2015 |
Faria et al.30 |
ARMD |
CS in ARMD |
69 patients (120 eyes); ARMD: 35 patients (54 eyes) and controls: 34 patientss (66 eyes) |
Cross-sectional |
SPARCS CS scores were significantly lower for patients with ARMD versus controls (p<0.001) |
|
2015 |
Richman et al.7 |
Glaucoma |
SPARCS introduced as an alternative to CS testing |
91 patients (136 eyes) |
Cross-sectional |
ICCs for SPARCS were 0.97 and 0.98 for PR; CORs for SPARCS were ±6.7% and ±6.4% for PR; SPARCS identified patients with glaucoma with 79% sensitivity and 93% specificity |
ADL = activities of daily life;ARMD = age-related macular degeneration;CAARV = compressed assessment of activities related to vision;COR = coefficient of repeatability;CS = contrast sensitivity;FSLASIK = femtosecond laser-assisted laser in situ keratomileusis;GQL-15 = glaucoma quality of life;HCQS = hydroxychloroquine;I-CAARV = Indian CAARV;ICC = intraclass correlation coefficient;IIH = idiopathic intracranial hypertension;LPI = laser peripheral iridotomy;MD = mean deviation;MGSS = modified glaucoma symptom scale;NEIVFQ-25 = National Eye Institute Visual Function Questionnaire;OCT = optical coherence tomography;PACD = primary angle-closure disease;PACG = primary angle-closure glaucoma;POAG = primary open-angle glaucoma;PR = Pelli-Robson test;PRK = photorefractive keratectomy;PSD = pattern standard deviation;PXG = pseudoexfoliation glaucoma;QOL = quality of life;RNFL = retinal nerve fibre layer;SPARCS = Spaeth/Richman Contrast Sensitivity;VA = visual acuity;VF = visual fields.
Glaucoma
CS has been shown to be a robust measure of the function of ganglion cells. In eyes with glaucomatous optic neuropathy, CS measures reflect the state of retinal ganglion cells (RGCs) and can also be sensitive to the magnitude or severity of damage.
Early detection, structure–function correlation and pre-perimetric glaucoma
Richman et al. studied the role of SPARCS in glaucoma patients and found that in the Caucasian population a total SPARCS score of <70 had a sensitivity of 79.7% and a specificity of 92.8% in the identification of glaucoma.7 The sensitivity and reliability of SPARCS scores in patients with varying severity of glaucoma have also been demonstrated by Thakur et al.23 The authors noted that SPARCS outperformed (sensitivity=84.4% and specificity =70%) the PR chart scores (sensitivity =80% and specificity =65.6%) for the detection of glaucoma. SPARCS was found to be more sensitive to glaucomatous damage compared with the PR test and had a better test–retest repeatability.
Changes in CS in glaucoma have been found to occur faster than normal ageing across the frequency range for both steady-pedestal tasks (exploring the spatial CS frequency, luminance and adaptation on CS) and pulsed-pedestal tasks (exploring both spatial and temporal CS, flicker sensitivity and adaptation dynamics), thereby suggesting a reduction in sensitivity that is not selective for MC or PC pathways.28 These observations suggest that a reduction in CS, especially in patients with glaucoma, occurs before VA and visual field change.
There is also evidence that correlates structural changes in the retina with functional changes in CS. Amanullah et al. assessed the retinal nerve fibre layer (RNFL) thickness using optical coherence tomography (OCT) and CS measures using SPARCS to demonstrate that CS in the left upper area of both eyes was correlated strongly with inferior quadrant RNFL thickness.24
When stratified by clock hours, this relationship was noted at the 7-o’clock sector for the left eye and the 6-o’clock sector for the right eye. This clock-hour position also suggested the consistently significant correlation between the RNFL thickness of the inferior quadrant (which is made up of clock hours 5, 6 and 7) and the SPARCS left upper area of vision. These RNFL fibres project to the temporal portion of the right occipital lobe, thus indicating a potential centre for contrast perception in this area of the brain.24
However, a loss of CS is diffuse throughout the field of vision, unlike the clusters of function loss (scotoma) seen on the visual field testing. More research is needed to ascertain how CS reduction is associated with the progressive loss of neural tissues in specific areas of the retina.
Regarding changes in CS following the initiation of glaucoma treatment, Ichhpujani et al. have shown that both central and peripheral CS improve following the intraocular pressure (IOP) reduction with a prostaglandin analogue, such as travoprost.32 Additionally, changes in CS also had a significant correlation with RNFL thickness and the perimetric indices.
Advanced disease, tackling floor effects
CS has been shown to be significantly worse in patients with moderate glaucoma as compared with those with early glaucoma.29
In a study conducted by Rao et al., contrast-specific thresholds were established for delineating visual field mean deviation (MD) beyond -20 and -30 dB. At these MD levels, floor effects in structural imaging often impede the accurate detection of glaucoma progression.17 Their findings underscored the fact that the aggregate SPARCS scores were pivotal in anticipating shifts in MD, with peripheral quadrants or PR scores exerting a minimal influence. Notably, when the cumulative SPARCS scores were decreased below 45 and 38, they were associated with advanced glaucoma stages where MD exceeded -20 dB (sensitivity =70.5% and specificity =80.9%) and -30 dB (sensitivity =79.3% and specificity =77.7%), respectively. This study highlights the potential utility of CS measures in patients with advanced glaucoma. There is also evidence that in patients with rapid progression, there is a significant reduction in CS at 1 year.22 Future research may evaluate CS loss trajectories in patients with varying rates of glaucoma progression to assess the potential of CS scores as markers for identifying patients with high-risk glaucoma.
Quality of life and visual disability in glaucoma
Multiple studies show that CS measured with SPARCS highly correlates with quality of life and actual ability of people to perform activities of daily living. This correlation has been found to surpass that derived from parameters, such as visual field metrics, VA, stereopsis and IOP.21,26 Furthermore, SPARCS has also been used to validate a new tool for compressed assessment of activities related to vision, named I-CAARV (Indian compressed assessment of activities related to vision), in the Indian population.20 Such findings underscore the significance of evaluating CS in clinical settings. The rationale is that it aligns closely with patient-reported outcomes and might offer a more authentic representation of patient experiences in comparison with traditional metrics, such as VA and IOP. There is also evidence that SPARCS can detect changes post-treatment and supplementation.11,19
Effects of laser procedures on contrast sensitivity
The impact of laser peripheral iridotomy (LPI) on CS is controversial. Anderson et al. reported changes in CS post-argon LPI. They noted a slight increase in CS at low spatial frequencies and a small decrease at high spatial frequencies post-LPI.33 However, Ichhpujani et al. did not find any change in either central or peripheral CS using SPARCS in patients with primary angle-closure disease post-LPI.13 More work is, however, needed to evaluate the impact of the location of LPI on CS, as it appears to be the most significant factor in determining post-LPI complications.34
Age-related macular degeneration
CS is a valuable indicator of functional damage in patients with AMD.35 The loss of CS is associated with compromised quality of life in patients with AMD.36
Logically, as AMD predominantly affects the central vision, testing contrast thresholds in peripheral visual fields may not be of a great additional value for detecting disease progression. However, as SPARCS tests CS in both central and peripheral areas, there is a reduced use of central vision to resolve letters in patients with AMD, and thus, CS can be ascertained easily.
Faria et al. have demonstrated that CS scores for patients with AMD are significantly lower as compared with controls using both PR chart test and SPARCS.30
The US Food and Drug Administration (FDA) mandates that CS can only be used as a functional endpoint in clinical trials if significant differences are reported in at least two spatial frequencies when tested with the Pelli-Robson chart, and CS does not fulfil the FDA criteria as a clinical trial endpoint.37 However, the relationship between CS and quality of life suggests that the benefits of treatment may be underestimated if CS is not considered. Therefore, future research must focus on the use of SPARCS in post-anti-vascular endothelial growth factor (VEGF) monitoring of patients with wet AMD. Such insights might then pave the way for home-based monitoring solutions, further enhancing personalized care strategies for patients with AMD.
Idiopathic intracranial hypertension
Idiopathic intracranial hypertension (IIH) is a persistent condition characterized by episodes of relapse and recovery and, thus, requires monitoring despite papilloedema resolution. Contrast deficits have been reported with intact visual acuity in patients with IIH.38 Rehman et al. used SPARCS and found decreased central and peripheral CS scores in IIH.18 In a comparative assessment between eyes that experienced recurrence and those that did not, no notable difference in CS was observed via PR chart assessments.12 However, there was a statistically significant difference in the total SPARCS score, especially in the peripheral superonasal, inferonasal and infertemporal regions. Recurring cases exhibited stability in VA and central CS but a marked decrease in peripheral CS. As the peripheral retina has a lower number of RGCs and is also optically affected by various aberrations, both factors could contribute to a worse peripheral CS than central CS in optic nerve dysfunction following optic disc oedema or glaucoma.39 Furthermore, due to sparse neural sampling in the peripheral retina, CS exhibits a sharp decrease after reaching a specific spatial frequency threshold.40
Refractive surgery
Higher-order aberrations (HOAs) of the eye have been associated with a reduction in CS.41 Refractive procedures can both reduce and increase HOAs. A recent study has shown that myopic photorefractive keratectomy results in a significant deterioration in CS measured using SPARCS as compared with femtosecond laser-assisted laser in situ keratomileusis refractive surgery.14 This study highlights the potential of SPARCS as an objective tool for evaluating post-refractive surgery outcomes. However, more work is needed to explore its utility across the multitude of refractive procedures available today.
Drug toxicity
Hydroxychloroquine (HCQ) is a drug commonly used for the management of chronic rheumatic disease but has known ocular adverse effects, ranging from non-significant keratopathy to sight-threatening retinopathy. HCQ affects the CS by acting on the retinal bipolar and ganglion cells. In patients with bull’s eye maculopathy, the earliest functional changes occur paracentrally. The macula is structurally limited by the small space to perceive contrast because of the limited number of photoreceptors in that area. Therefore, tests that assess only central CS are not doing justice to the value of CS assessment in these patients. SPARCS has been used to demonstrate the decrease in central and peripheral CS in patients taking HCQ. This reduction in CS can be a sign of early visual dysfunction and, hence, may be considered an early indicator of HCQ toxicity.15 Table 1 summarizes the salient studies using the SPARCS test for various ophthalmic disorders.
Summary
SPARCS has emerged as an effective alternative for CS assessment across a diverse array of eye conditions over the last few years (Figure 1). Distinctively, it can measure not just central but also peripheral CS variations, bridging a critical gap in the current CS evaluation techniques. The potential integration of CS testing into conventional clinical evaluations will thus not merely be a procedural enhancement; it represents a paradigm shift. This is underscored by the strong correlation between CS and the ability of patients to perform daily activities and their perceived quality of life. Hence, using leveraging tests, such as SPARCS, for CS assessment, clinicians will be better equipped to offer comprehensive care. As we stride forward in the field of ophthalmology, such novel tools will play an instrumental role in refining diagnostic and therapeutic strategies and, in turn, elevating the standards of patient care.
Figure 1: Infographic showing the utility of Spaeth/Richman Contrast Sensitivity test since it was introduced in 2015
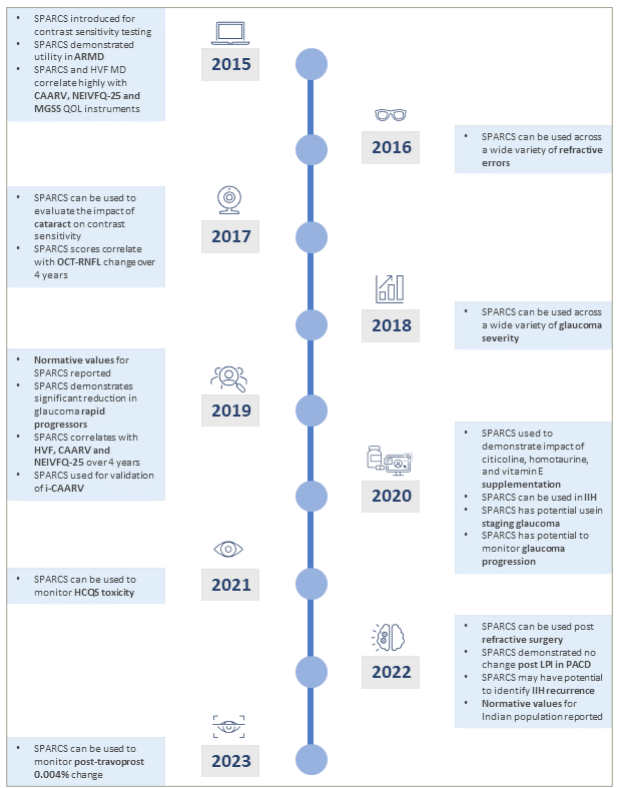
ARMD = age-related macular degeneration; CAARV = compressed assessment of activities related to vision; HCQ = hydroxychloroquine; HVF = Humphrey visual field; IIH = idiopathic intracranial hypertension; LPI = laser peripheral iridotomy; MD = mean deviation; MGSS = modified glaucoma symptom scale; NEIVFQ-25 = National Eye Institute Visual Function Questionnaire; OCT = optical coherence tomography; PACD = primary angle-closure disease; QOL = quality of life; RNFL = retinal nerve fibre layer; SPARCS = Spaeth Richman Contrast Sensitivity.