Oculoplastic surgeons are often faced with the diagnostic dilemma of abnormal tissues within the orbit and adnexal structures. In many cases, the associated signs, symptoms and radiological appearances allow a tentative differential diagnosis to be formulated. However, most often, diagnostic dilemma prevails, leading to frequent surgical intervention in the form of tissue biopsy for diagnostic, rather than therapeutic, purposes.
The gold standard remains a histological diagnosis from a tissue biopsy, but achieving this consistently requires invasive surgery with its associated risk of loss of vision. Conventionally, radiologists use a set of characteristics known to be associated with a particular tissue or tumour type and deduce a diagnosis from these.1 The use of magnetic resonance imaging (MRI) as an adjunct to a histological diagnosis is well established and documented. The diagnostic accuracy of advanced MRI techniques like short time inversion recovery (STIR) sequences for distinguishing active versus inactive thyroid-associated orbitopathy has already been validated and is used to measure response to steroid treatment in conjunction with an improvement of clinical activity score.2 But there are still pitfalls of image interpretation: misinterpretation, misapplication of diagnostic criteria and difficulties in interpretation owing to previous surgical or therapeutic interventions.3,4 In a recent study by Koukkoulli et al., a correct diagnosis on orbital tumours was achieved in <50% of cases by both ophthalmologists and radiologists alike before a histological diagnosis was made.5 The imaging reports are in concordance with histology in only 30% of cases and more than three-quarters of all orbital biopsies were done only for diagnostic purposes.5 In their MRI study on breast cancers, Holli et al. concluded that although the location of the lesion and its margins can usually be determined, the histopathology of the lesions may be difficult to characterise by conventional MRI alone and additional tools are needed for accurate diagnosis.3 Radiology departments are also dealing with an ever-increasing demand to produce formal reports in a timely manner. Therefore, clinicians and patients alike would welcome the development of new technologies in non-invasive imaging techniques that can safely guide diagnosis and narrow down differential diagnoses. The reproducible quantitative texture analysis method is one such technique that aids in the detection and classification of pathological findings in MRI images.6–8 This technique analyses various characteristics of an image and categorises different regions using spatial transformation of data acquired from the images. Texture of an object is an important surface property used to identify and recognise objects by the visual cue of repetition of image patterns.9–12 Similarly, MRI images have visual patterns that could be smooth, rough, regular, irregular, coarse or fine, with additional features such as brightness, colour, slope, uniformity, density, linearity, frequency, phase, directionality, randomness and granulation.6,8,13 The human eye can recognise these qualitative features in the texture of greyscale or colour images, but cannot quantify them.8,13 The texture features of a medical image may provide valuable information for diagnosis, since tissue properties tend to change according to the pathology, which in turn promotes a respective change in image texture.
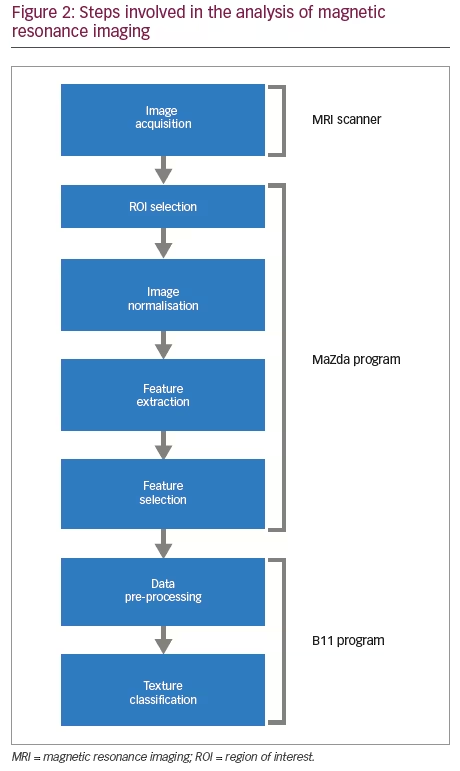
In this study we aim to demonstrate proof of the concept that quantitative texture feature analysis software (MaZda) could be applied to MRI scans of various orbital pathologies to produce a unique footprint and extract information about tissue properties. MaZda is a publicly available, free computer software package, available to download from www.eletel.p.lodz.pl/programy/mazda/, that provides quantitative information about the internal structure of physical objects (such as human body tissue) by computing texture analysis parameters for MRI images.14,15 The MaZda package has computer programmes that allow interactive definition of regions of interest (ROIs) in images, computation of a variety of texture parameters for each ROI, selection of the most informative parameters, exploratory analysis of the texture data obtained and automatic classification of ROIs on the basis of their texture. MaZda software has been designed and implemented as a package of two Microsoft Windows® computer applications: MaZda.exe (for image processing, feature selection and extraction of textural features) and B11.exe (for data visualisation, classification and segmentation).14,15 It does this by mathematically summarising the signal intensity of pixels within a chosen ROI. The steps involved in analysing a particular region of the image and classifying it are briefly discussed here, but are elaborated upon extensively in the downloadable documents available from the software website.16–18 The texture analysis data produced is in several-hundred-dimensional spaces and is not easy to handle by statistical analysis or by classifiers. Thus, MaZda employs techniques for reduction of feature vector dimensionality by selecting the most discriminative features for further analysis and displaying relations between features and texture class.
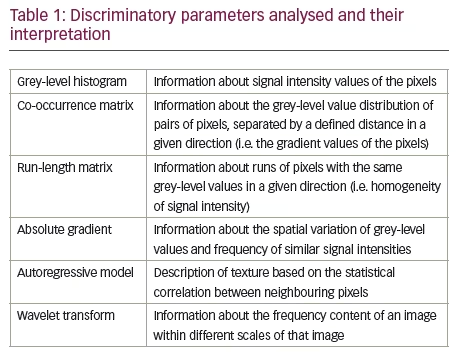
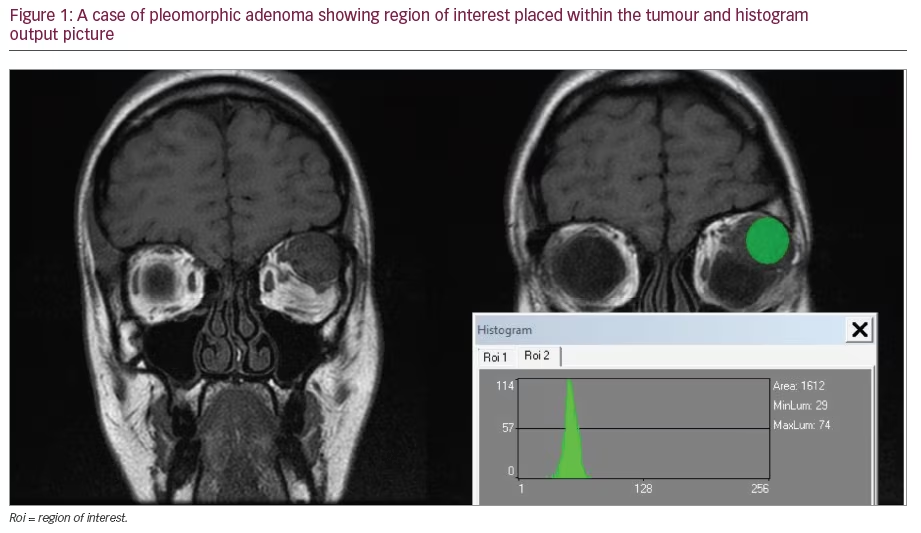
The software can take input rules for texture classification. Texture classification determines to which of a finite number of physically defined classes a homogeneous texture region belongs. The features generated are grouped as: histogram, gradient, co-occurrence matrix (COM), run-length matrix (RLM), autoregressive model and Haar wavelet groups, descriptions of which are given in Table 1. The most common statistical method for image feature computation is based on image first-order histogram (Figure 1). The histogram is computed from the intensity of pixels, without taking into consideration any spatial relations between the pixels within the image. Features are simply statistical parameters of the histogram distribution, such as mean brightness, variance, skewness, kurtosis and percentiles. The grey-level COM is a second-order histogram, computed from intensities of pairs of pixels, where the spatial relationship of the two pixels in a pair is defined.
Summarising, MaZda software allows computation of nine histogram-based textural features; 11 COM-based features derived from 20 COMs produced for four directions and five inter-pixel distances; five RLM-based features at four different directions each; five gradient-map-based features; five based on an autoregressive model; and up to 20 based on the Haar wavelet transform (Table 1). Altogether, 279 descriptors that can characterise a greyscale image texture produce a substantial set of features potentially carrying sufficient information for image texture characterisation or region classification. Usually only a limited number of features carry relevant information needed for texture discrimination. MaZda allows selection of these features and rejection of the rest. Changes in these selected features in time can also quantitatively reflect changes in tissue’s physical structure, signifying progression,14,15 so these technologies could be used for monitoring and prognostication of orbital tumours. We hope that with further development, such image analysis can be used as an adjunct to the reference benchmark of histology of biopsy specimens. This is an innovative use of existing technology in the imaging and analysis of orbital disease which, to our knowledge, has not been previously reported. Essentially, this can be regarded as the histological analysis of a greyscale image. Application of this texture analysis technology has already been in practice in the food product industry and agriculture,19,20 and in the recent past there have been studies published using this technology in other medical specialities, which we present in the discussion section.
Methods
Ethics approval was not required for this study. All procedures were followed in accordance with the responsible committee on human experimentation and with the Helsinki Declaration of 1975 and subsequent revisions. Written informed consent was not obtained from the patient cases included in this article as no identifying information or images have been used.
Image acquisition
Only MRI head images with specific orbit sequences carried out for diagnostic purposes were included, and those done only for lesion localisation were excluded. MRI scans were retrospectively selected from 13 patients with a known histological diagnosis of orbital pathology. All scans were done from the same radiology unit and the scanning protocols followed for orbital lesions were: coronal and axial T1W turbo spin echo (TSE), coronal STIR, axial T2W TSE with fat suppression (FS), and coronal and axial T1W TSE FS with gadolinium enhancement. The scans were carried out on a variety of 1.5T scanners: InteraTM and Achieva (Philips Research Eindhoven, Amsterdam, the Netherlands), and SignaTM and OptimaTM (GE Healthcare, Chicago, IL, US). Two patients were scanned on a Signa 3T scanner, and their images were excluded from the study. For patients scanned at 1.5T with dedicated orbit sequences, coronal and axial images were acquired at 3.0 mm thickness with 3.3 mm spacing, coronal field of view 170–220 mm and axial field of view 180–240 mm. A field of view of 260 mm in axial and coronal planes was used for patients scanned at 3T.
Normalisation
The scans were anonymised and analysed in MaZda software (version 4.6) and its integrated B11 analysis programme (version 3.3). All four T1W sequences and T2W were selected for analysis. The raw images were saved as bitmap images and uploaded into the MaZda software (version 4.6). The image was first normalised to nullify the effects of brightness, contrast variation and other biases. Image intensities in the range of m +/− 3 s (µ = grey-level mean; m = grey-level standard deviation) were normalised for grey levels to reduce the dependence of higher order parameters on first-order grey-level distribution.14,15 This method remaps an image histogram in a range with the mean luminance in the middle and a span of three standard deviations onto the white-to-black greyscale range. Previous studies have shown that texture analysis can provide reproducible results under different MRI acquisition protocols if appropriate normalisation is used.21
Selecting region of interest
An ROI was selected manually at three levels for each image, one slice above and below the largest diameter of the pathology, because applying ROI to a single slice might not be representative of textural information for the entire lesion. Combining the textural information from different slices should yield a more complete description of the lesions’ textural features. The ROI is indicated with a superimposition of manually selected colour areas on the greyscale image (Figure 1). Up to 16 ROI profiles may be defined with the use of 16 unique colours. MaZda analysis is performed within the ROI. A multidisciplinary consensus was reached among all the authors (ophthalmologists and radiologists), in agreeing with the boundaries between normal and pathological tissues, and avoided including any adjacent healthy tissues.
Statistical analysis of data
The output data from MaZda was presented in 10-dimensional data space with nearly 300 parameters. A unique histogram was produced for each ROI and the mean of histogram data for all the pathologies was analysed on MedCalc software (version 18.10.2) using repeated measures analysis of variance (ANOVA). To analyse intra-tumour variability at different ROIs of the same slice or image slices at various levels or image slices in different axes, signed rank sum statistical test was used. Mann-Whitney U test was used to compare the features between two pathologies. Sensitivity and specificity of MaZda differentiating normal and pathological tissue in the orbit was tested using area under the receiver operating characteristic curves (AUROC). Of all texture parameters produced, feature selection or extraction methods inbuilt into the software helped to choose the 10 most informative parameters. These parameters were derived based on Fisher coefficients (ratio of between-class to within-class variance), minimisation of both classification error probability and average correlation coefficients (POE + ACC) and mutual information coefficients, which measure the dependence between two or more random variable coefficients and a selection of optimal feature subsets with minimal classification error of 1-nearest neighbour (1-NN) classifier. The B11 statistical program of MaZda further processed this data to lower dimensional data space using linear transform methods and classifiesd the image texture pattern.14,15 The statistical linear transform method used for analysis was by linear discriminant analysis (LDA) to reduce the feature vector dimension and increase the discriminative power. The ROI was classified (texture classification) to a finite number of physically defined classes (e.g. normal or abnormal tissue) and a 3D surface geometry was reconstructed from texture information. Feature vectors can be applied to the input of a device called a classifier. On the basis of its input, the classifier took the decision as to which predefined texture classes its input represented. The B11 programme implemented two procedures for non-linear supervised classification: 1-NN classifier and an artificial neural network. The 1-NN incorporated a simple learning algorithm in which generalisation was performed after collecting all the training data. During the training phase, feature vectors and class labels of the training samples were simply stored. In the classification phase, distances from a new sample to all the stored feature vectors were computed.
Three-dimensional graphic representation
The three-dimensional distributions of data vectors are based on the co-occurrence texture features selected with the minimal classification error of the nearest neighbour classifier (1-NN).14,15 An example of three-dimensional graphic representation is discussed in results section. The step-by-step approach taken in analysing the images is given in Figure 2.6
Results
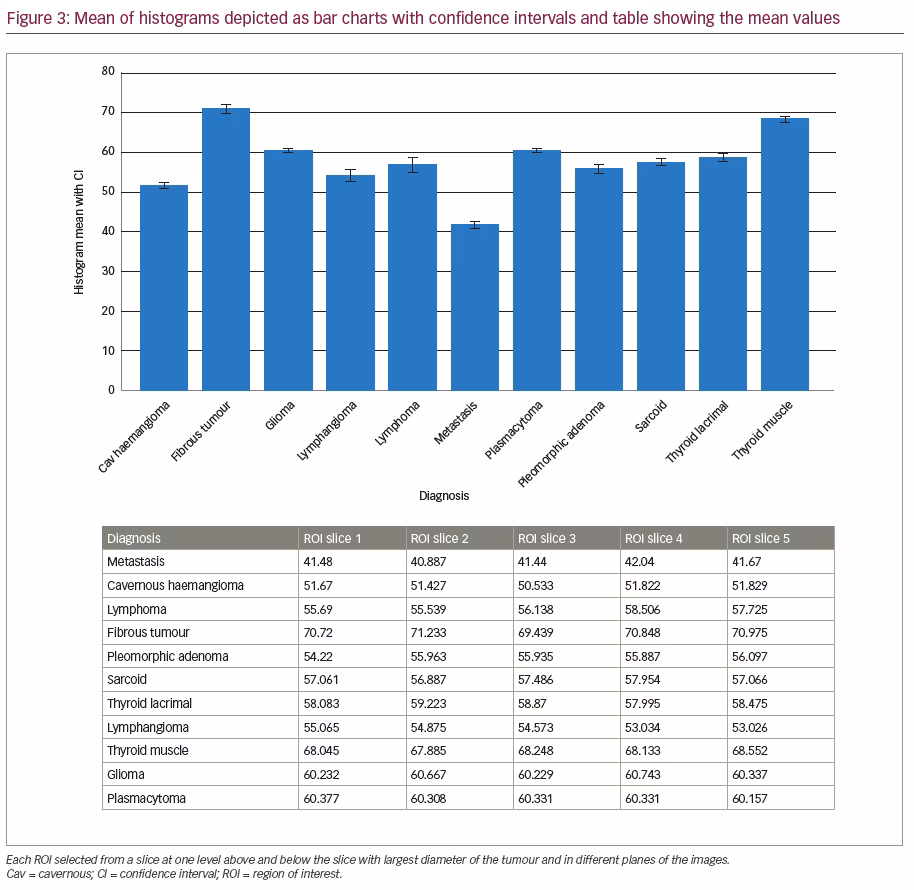
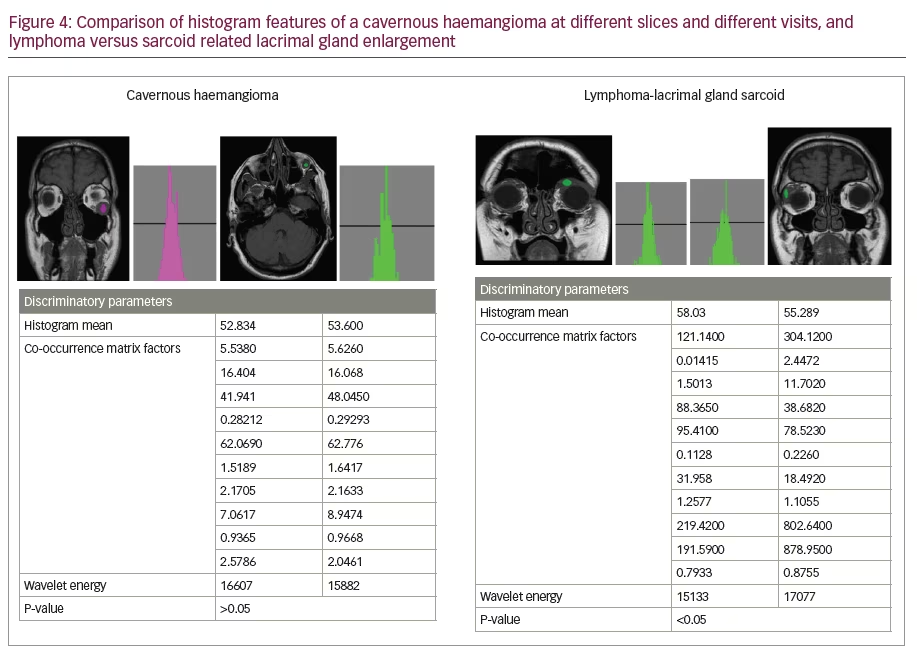
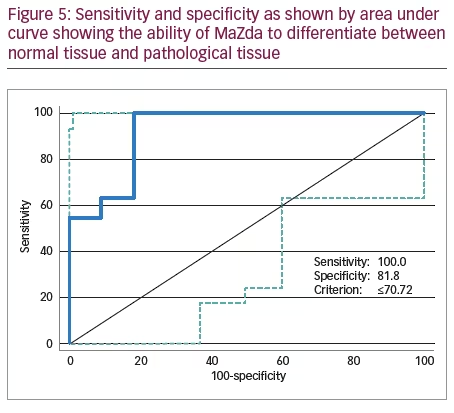
We excluded two cases who had scans on the 3T scanner and had orbital dermoid and myositis. Of all the scans assessed on the remaining 11 patients with different orbital tumours, there was a statistically significant difference between mean histogram values of various orbital pathologies (p<0.001) as analysed by repeat measures ANOVA. Mean histogram values for all the orbital pathologies are graphically represented with confidence intervals given in Figure 3. The signed rank sum test did not show any intra-lesion ROI differences in features or differences in mean between ROIs in slices at different image levels of the same pathology or differences between coronal and axial slices from the same series of images (>0.05). Figure 4 shows two examples of histogram features, where in the first picture, two slices in different axes and at different patient visits were selected for cavernous haemangioma with no statistical difference in features. The other example in Figure 4 is that of lymphoma compared with lacrimal gland enlargement secondary to sarcoidosis, with statistically significant difference in histogram mean. There was also high sensitivity to detect pathological tissues, but as evident from the statistical results given in the AUROC in Figure 5, MaZda showed specificity of only 81.8%. Particularly, the specificity was poor in differentiating normal brain tissue and glioma; orbital fibrous tumour and muscle fibrotic changes in thyroid eye disease as represented by number of misclassifications between these tissues is given in Table 2. The interesting observation is that these orbital pathologies with fibrotic changes had overlapping pixel intensities and mean histogram values akin to normal brain tissue, as evident by the number of misclassified samples between normal brain tissue and a fibrous tumour, as given in Table 2.
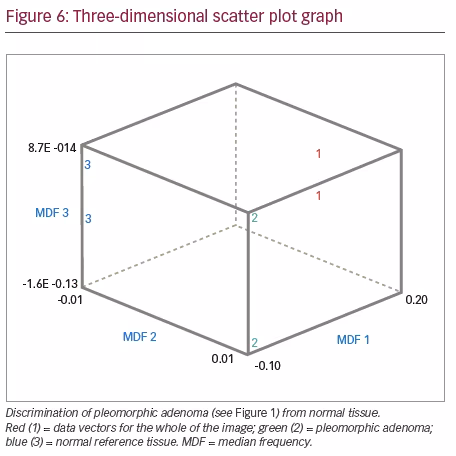
The differential feature patterns recognised in the histogram were also reflected with other texture parameters analysed by the B11 programme. Classification results of texture analysis between the tumour area and healthy reference area or between different tumours as assessed by LDA is given in Table 2. The rates of correctly classified data vectors were used as the primary outcome variable. This strategy of texture-based lesion classification has been used in previously published papers.3,22 A three-dimensional graphic representation of the dissimilarities between the ROI clusters is shown in Figure 6. In this example, texture features of an image of pleomorphic adenoma are compared with reference healthy tissue, in this instance brain tissue. Each cluster cloud is represented by one specific tissue type assessed. The distance between the cluster clouds indicate the dissimilarities in texture features on MRI images. As evident from Figure 6, the cluster clouds are widely dispersed in the three-dimensional space, indicating different texture features between pleomorphic adenoma and normal reference tissue.
Discussion
MaZda texture analysis is an experimental method, but better correlation of parameters with histopathological structures will provide a new tool for analysing abnormal orbital tissues. Changes of properly selected texture parameters in time can quantitatively reflect changes in tissue physical structure, e.g. to monitor progress in healing. The key features of this technology are: valuable information from texture features; proof of concept for non-invasive classification of various pathologies; prognostication and monitoring by assessing tissue changes (Figure 4); a useful adjunct tool to histopathology; expertise in image analysis can be enhanced once a standard protocol is established; and the fact that this technology is already in practical use in other non-medical fields such as agriculture and the food industry for quality assurance.19,20 This idea of applying non-invasive methods to analyse tissue texture has also been put into practice in other medical disciplines. Holli et al.3 demonstrated that T1 weighted pre-contrast, post-contrast and subtracted images in breast cancer images could be analysed and classified with texture analysis. Assessed COM-based parameters showed good discriminatory power between different types of cancers.3 Fruehwald-Pallamar et al. demonstrated that apparent diffusion coefficient and texture features varied significantly in parotid tumours.22 Orphanidou-Vlachou et al. demonstrated the diagnostic uncertainty in conventional radiological reporting of posterior fossa tumours. In their series of 40 patients, even in those where the correct diagnosis was specified, 22% had alternatives proposed.5 The other quantitative analysis techniques for radiological images include magnetic resonance spectroscopy and diffusion imaging.5 Bahl et al.23 demonstrated good sensitivity and specificity when distinguishing between normal and cirrhotic liver using MaZda texture analysis of T2-weighted MRI images. They used the MaZda programme to perform dichotomous classification of liver fibrosis from double-contrast-enhanced MRI images. This allowed them to classify patients as having either none to moderate fibrosis or advanced fibrosis, with a cross-validated classification accuracy of 88.2%. However, this represents the use of imaging in the monitoring and prognosis of a pre-determined diagnosis rather than an initial identification. Watanabe et al. studied the effect of age on the texture of orbital tissues.24 They assessed 38 patients who underwent an orbit MRI scan. T1 and T2 images were obtained with ROI in six intra-orbital tissues (recti muscles, orbital fat, lacrimal gland and optic nerve) and compared them with corresponding extra-orbital tissue (masseter muscle, cheek fat pad, buccal fat, parotid gland and frontal grey matter). They demonstrated that T2 values for extraocular muscles showed a strong, positive correlation with age, while T1 values demonstrate weakly positive associations with age. No gender difference was detected between T1 and T2 images. Intra-orbital structures demonstrated specific quantitative MRI measurements and aging patterns, which were different from extra-orbital structures.24 Herlidou et al. demonstrated usefulness of quantitative texture analysis of MRI scans in monitoring osteoporosis.25 Other MRI quantification methods are also in use, which could also contribute to narrowing down the differential of orbital pathologies. The utility of quantitative MRI in the orbit has been investigated, particularly in Graves’s ophthalmopathy, showing positive correlations between increased T2 or STIR signals and disease activity or therapy responses.26–29
Other quantitative MRI studies include the assessment of signal intensities on T2-weighted images or STIR in patients with optic neuritis30–32 and apparent diffusion coefficient (ADC) measurement of the lacrimal gland in Sjögren’s syndrome.33 Sepahdari et al.34 and Fatima et al.35 were able to characterise orbital tissues using diffusion-weighted MRI and ADC value, and the ability to differentiate between malignant and benign orbital tumours.
The limitations of this study are: MaZda is still an experimental research tool and expertise is required to analyse images using the software; orbital masses are rare and the numbers of each individual pathology we had were limited to derive any meaningful algorithm to test for sensitivity and specificity at detecting any specific pathology;36 hence AUROC statistics were used to differentiate abnormal tissue from normal tissue. Various MRI texture features differ between the pathologies, but we did not have statistically significant enough numbers of individual pathologies, all scanned under standard protocols, to derive any algorithms to detect orbital pathology by texture analysis. Normalisation algorithms for the image processing have to be standardised before this ever has any clinical use; further larger studies are required to establish reference standards; since this is a retrospective study robust control over methodology was not possible, such as time duration between pre- and post-contrast images, repetition time and echo time of MRI sequences, which could have affected the texture pattern.
Other potential limitations with this technology could be difficulties in standardising procurement of images and optimal MRI data collection strategies. Different measuring techniques, such as spin echo, gradient echo and echo planar and different measuring parameters produce totally different patterns in texture.37 In addition, artificial texture is added by the scanner.37 A large number of different measuring techniques and imaging patterns add to the difficulties. There is the potential chance of misinterpretation of textures in tumours with varying characteristics like dermoid, which has a heterogeneous character, as also reported in the study by Holli et al.,3 where central necrosis in breast cancers leads to texture misclassifications.
Conclusion
This study showed the proof of concept that, should we develop a texture analysis library of pathologies correlating with histology, then non-invasive classification of orbital tissue pathology is possible by applying quantitative texture analysis to MRI scans. The advantage of texture analysis is that it directly assesses the architectural structure of orbital tissues. Further studies are needed to produce a larger reference frame of tissue histograms in histological confirmed diseases and to gain meaningful values for the sensitivity and specificity of these techniques in different orbital pathologies. In the future, more complex statistical techniques may be applied to develop classification models for orbital disease based on texture analysis parameters.
Such software could therefore provide a useful, non-invasive classification method for orbital tissues and disease processes when used as an adjunct to a radiological opinion whilst not discounting histology as the reference standard. Readily available access to picture archiving and communicating systems now allows ophthalmologists to review MRI images before a radiologist has generated a formal report. With increasing pressure being placed on radiologists in terms of the turnaround times for scan reports, this software tool may facilitate more rapid active intervention. It may also prove useful in cases of indeterminate histology or as an additional facet to narrow down a differential diagnosis in cases where achieving a tissue diagnosis is technically challenging and poses a high risk of iatrogenic morbidity. More detailed validation studies will be required before the software could be feasibly used in any sort of clinical practice.