Optical coherence tomography (OCT) is a revolutionary tool that plays a key role in the management of various retinal pathologies. The salient features of OCT are its non-invasive nature and its ability to image intraocular structures in vivo with resolution comparable to that of histological sections.1 Of late, various angiography tools based on OCT technology have evolved that provide a three-dimensional picture by studying the microcirculation, and at the same time remain non-invasive.2
OCT angiography (OCTA) is a functional extension of OCT.3 Even though it is still under the process of development and continuous evolution, OCTA can produce high-resolution images of blood flow of all the vascular layers of the retina and choroid in a rapid, non-invasive fashion.4 It uses motion contrast imaging to produce high-resolution volumetric blood flow information, generating angiographic images in a matter of seconds.5
Principles of OCTA
OCTA is based on the principle of decorrelation, which involves interferometry analysis of short-coherence-length light reflected from moving blood within the retina and choroid, and calculates the variation over time of reflectance parameters (e.g. amplitude or phase).3,6 Volumetric information is generated by sequentially acquiring multiple B-scans, which are displaced perpendicular to the B-scan image, covering a region of the retina or anterior eye using raster scan. The retina is a stationary object for the most part, so if successive B-scans at the same position are acquired, they will be largely similar, except for the motion of blood within the tissue. At the sites of blood flow, the reflectivity or scattering changes from one scan to the next. By comparing repeated OCT B-scans, it is possible to image blood flow by looking for differences among the scans on a pixel-by-pixel basis.4 OCTA can generate three-dimensional maps of microvasculature flow pattern from retinal capillary plexus and choroidal vasculature, and its capabilities have enabled us to better understand, analyze, and treat a number of retinal pathologies.7,8
History of OCTA development
The arrival of OCTA in the ophthalmic world occurred around a decade ago. In order to detect and measure blood flow, previously studies used Doppler techniques, which compared the phase of successive OCT A-scans.9,10 Zhao et al., in their study published around 15 years ago, reported that blood vessels could be visualized using Doppler OCT with time-domain OCT by extracting and comparing the A-scan phase changes, which are related to the Doppler frequency shift.11 This method was known as ‘optical Doppler tomography’ and was demonstrated for dermatological imaging of blood vessels in the skin. As time passed by, and with further advancements in ophthalmic biomedical engineering and development of spectral domain OCT (SD-OCT), the phase of the A-scans became directly accessible and imaging speeds increased. It was not until 2005 that Zhang and Chen demonstrated that blood flow could be visualized using swept source OCT (SS-OCT) by measuring the variance of the Doppler signal and intensity variation without phase.12 These advancements led to OCTA, which is currently marketed globally.
Comparison of OCTA with FA and ICGA
Fundus fluorescein angiography (FA) and indocyanine green angiography (ICGA) are considered as gold standard modalities for the diagnosis of various retinal and choroidal pathologies, respectively. Both are invasive tests that require intravenous administration of dye and imaging, taking up to 10–30 minutes.13,14 They provide two-dimensional image sets that allow for dynamic visualization of blood flow with a wide field of view. Therefore, patterns of dye leakage, pooling, and staining can be seen. However, FA cannot separately visualize the intraretinal structures of major capillary networks; the images of superficial and deep capillaries overlap, so two of the three major capillary networks (superficial retinal, deep retinal, and choriocapillaris) do not appear to be imaged well despite the retina being a nearly transparent structure. Weinhaus et al. reported that FA does not image the deeper capillary plexus well in monkey eyes.15
FA and ICGA have other drawbacks that can limit their widespread use. Since they are invasive, relatively expensive, and time-consuming, they are not ideal techniques to use on a regular basis in a busy clinical setting. Although considered safe, the dyes pose risks ranging from nausea to allergic reactions, including anaphylaxis in rare instances. Aside from allergic reactions, of which the likelihood increases with frequency of use, indocyanine green dye is contraindicated in pregnancy and kidney disease.3,5 For the evaluation of patients requiring frequent follow-up exams or those that may not tolerate injection of intravenous dye, a rapid non-invasive technique to visualize retinal and choroidal vessels would be beneficial.
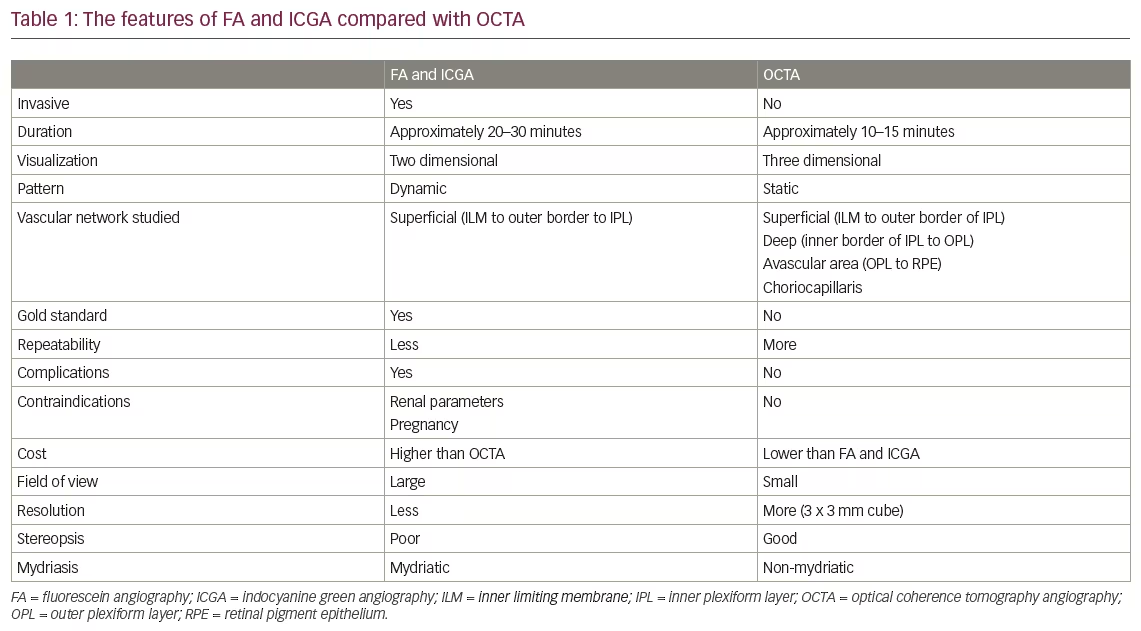
OCTA, in comparison, is a non-invasive technique that acquires volumetric angiographic information without the use of dye. The time taken to obtain each three-dimensional scan is much less than that of FA. The en face images (OCT angiograms) can then be scrolled outward from the internal limiting membrane to the choroid to visualize the individual vascular plexus and segment the inner retina, outer retina, choriocapillaris, or other area of interest. The en face acquisition areas range somewhere between 2 × 2 mm to 12 × 12 mm (in general for most of the OCTA machines), with the scan quality greatly decreased with a widened field of view since the same number of OCT B-scans is used for all scanning areas. The comparison between invasive FA and ICGA with non-invasive OCTA is summarized in Table 1.
Image acquisition in OCTA
A voxel-by-voxel calculation of decorrelated signals is performed by OCTA imaging software (Nidek RS-3000 Advance; Nidek, Aichi, Japan). The software scans 256 voxels in the particular area of field selected by an examiner, with eight B-scans repeated at each voxel.16 Further, at each voxel the software performs 256 A-scans per B-scan, with a distance between B-scans of 10 μm. The number of B-scans performed per voxel and the number of A-scans per B-scan varies according to the software and the algorithm used. Algorithms incorporated into the software perform computations based on clusters of B-scans and generate flow patterns based on motion of erythrocytes within the vasculature. This results in the formation of en face images retinal capillary network and choroidal vasculature at various levels.6,7
Various technologies in OCTA (spectral domain versus swept source OCTA)
SD-OCT uses a spectrometer and a line scan camera to capture images. The limited spectrometer resolution causes detection sensitivity to vary for OCT signals at different axial ranges, a phenomenon known as sensitivity roll off.4 The various commercial OCT instruments typically operate at 70,000 axial scans per second. SS-OCT uses a frequency swept laser and a high-speed detector, without requiring a spectrometer. The sensitivity roll off is much less in SS-OCT compared with SD-OCT because frequency swept lasers can have narrow frequency line-widths. Although the detection system for SS-OCT is less expensive than the spectrometer and line scan camera used for SD-OCT, laser light sources used in SS-OCT are currently expensive, making SS-OCT more costly.
Historically, OCT imaging was performed at 840 nm because super-luminescent diode light sources used for laser gyroscopes were at these wavelengths. Longer wavelength light at 1,050 nm has been shown to reduce the attenuation from ocular opacities and improved penetration into the choroid.17 It was demonstrated that 1,050 nm wavelengths can have superior image penetration and less attenuation than 840 nm wavelength.4 However, since SS-OCT is yet to be widely available commercially, the SD-OCT continues to be the most commonly available and widely used tool.
OCTA imaging in various clinical scenarios
OCTA in normal eyes
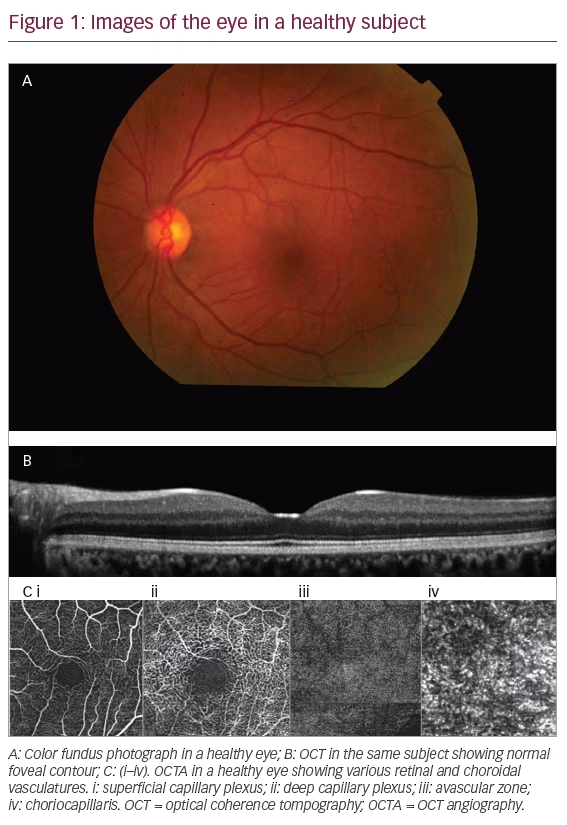
OCTA technology, on the basis of its image acquisition technique, provides data on retinal and choroidal vasculature by relaying information in terms of five zones. These include, superficial capillary plexus in combination with intermediate and radial peripapillary capillary plexus, deep capillary plexus, avascular zone, choriocapillaris, and choroid. In normal eyes, the foveal area comprises of a region solely containing cones with elongated outer segments underlying a capillary‐free zone; this is called the foveal avascular zone (FAZ). Various studies in literature have shown variations in the FAZ in terms of its thickness, shape and area.18–22
Other studies have analyzed the OCTA features of superficial and deep capillary plexus and the various morphological characteristics in order to understand the pathological aspect.23,24 They confirm the existence of separate vascular networks in the inner retina: the superficial network (in the nerve fiber layer and the ganglion cell layer) and the deep network (in the outer plexiform layer). Both networks are interconnected with numerous vertical vessels.23,24
The software incorporated in various OCTA prototypes, devised by various companies, provides certain options to visualize various vasculature levels in different cube sizes. These include cube sizes ranging from 3 x 3 mm to 12 x 12 mm OCT angiograms (Figure 1).
OCTA in diabetes
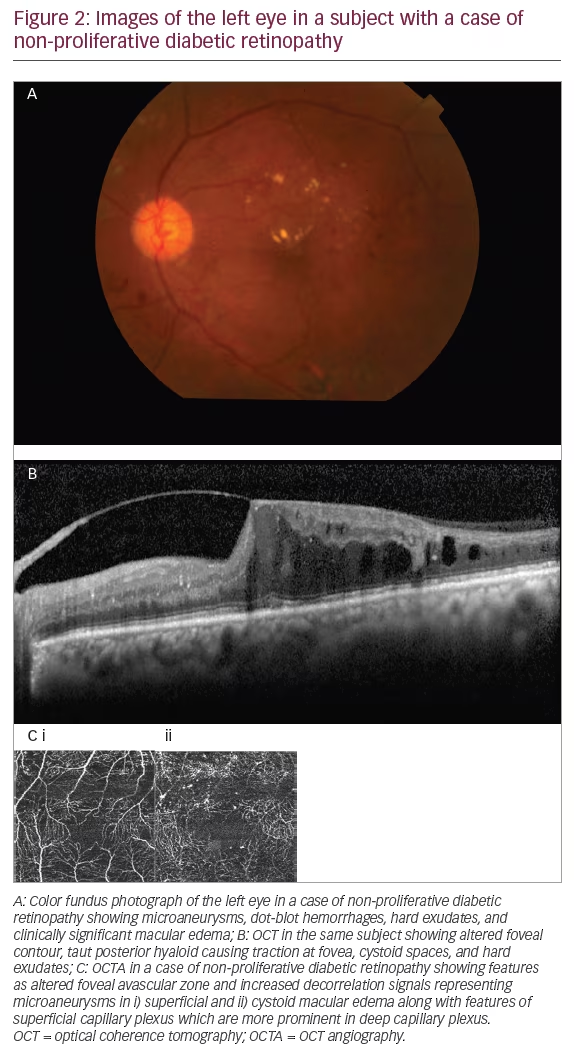
Diabetic retinopathy (DR) is one of the leading causes of blindness in the world, and cases increase as the years pass by due to the poor eating habits and lifestyle of the population.25,26 OCTA is a promising non-invasive modality to identify features ranging from mildnon-proliferative DR to a fully established proliferative DR.25 Only in the presence of vitreous-hemorrhage can scans not be obtained as signals cannot approach the underlying retinal surface. Various features of DR have been studied including micro aneurysms,26,27 retinal capillary perfusion density,27,28 hard exudates,27,28 FAZ measurement,27,28 capillary tortuosity and dilation,28,29 early neovascularization elsewhere, and neovascularization at disc.26–29 OCTA also has the ability to show the architecture of neovasculature underlying the leakage demonstrated on FA in a case of proliferative DR (Figure 2).
OCTA in age-related macular degeneration
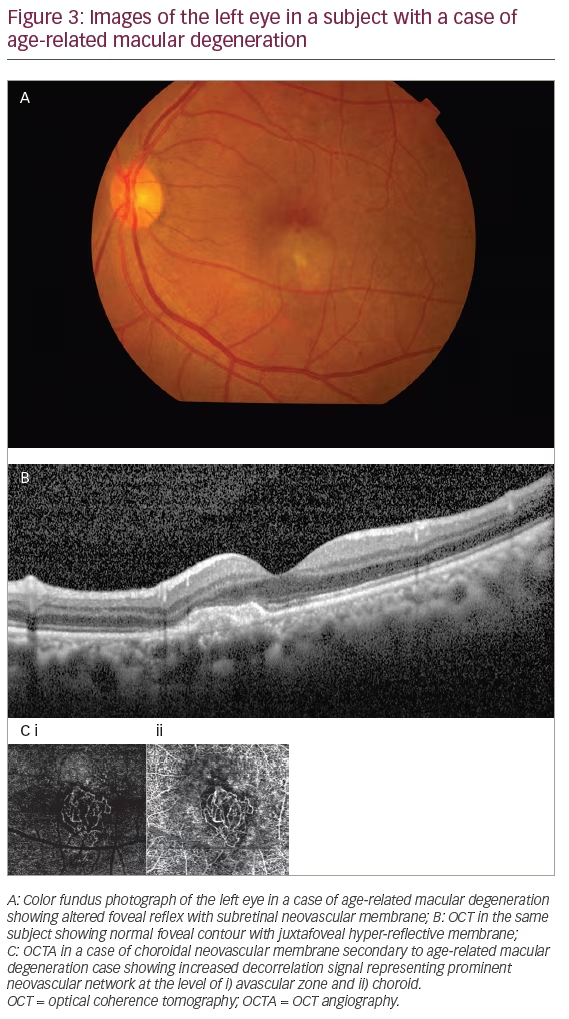
Age-related macular degeneration (AMD) is the leading cause of blindness amongst older adults (aged >50 years) in the western world.30 It exists in two major forms as dry AMD and neovascular AMD. Dry AMD is characterized by the formation of drusens, and in its most advanced form can result in significant loss of vision due to geographical atrophy involving the macula. On the other end of the spectrum is neovascular AMD, which is an advanced form of macular degeneration.31 Neovascular AMD has a peculiar feature of choroidal neovascularization (CNV) in which abnormal blood vessels that originate from the choroid grow through Bruch’s membrane and extend into the sub retinal pigment epithelium (RPE) and/or sub retinal space. CNV can result in hemorrhage, fluid exudation, and fibrosis, resulting in photoreceptor damage and vision loss.32
The tool of choice for diagnosing AMD is FA. However, due to the invasive nature and various side effects of FA, OCTA can be used as an alternative non-invasive tool. Various authors have described CNV membrane morphology and pattern on the basis of OCTA.33,34 Two patterns of membrane complex, the ‘medusa-like’ and the ‘sea fan-like’, have both been characterized by a large main central vessel trunk.35 SS-OCT has also demonstrated the presence of a feeder vessel and linked it to chronic and mature neovascular complexes associated with chronic pigment epithelium detachment and long-standing anti-vascular endothelial growth factor (VEGF) therapy.33–36
Coscas et al. evaluated 80 eyes with neovascular AMD using OCTA scanning and identified different patterns of CNV.37 Traditional multimodal imaging, based on FA, ICGA, and SD‐OCT, was also done to assess the need for treatment. Based on OCTA findings, they classified neovascular AMD into the following patterns:
1) a well‐defined (lacy‐wheel or sea‐fan shaped) CNV lesion in contrast to one with long filamentous linear vessels;
2) branching, numerous tiny capillaries, typical of a recent lesion, in contrast to rare large mature vessels, typical of a mature one;
3) presence of anastomoses and loops;
4) morphology of the vessel termini, assessing the presence of a peripheral arcade in contrast to a “dead tree” appearance; and
5) presence of a perilesional hypo intense halo considered as regions of choriocapillaris alteration, either corresponding to flow impairment steal or localized atrophy (Figure 3).
De Carlo et al. described characteristics as well as the sensitivity and specificity of detection of CNV using OCTA.38 In their study, the specificity of detecting CNV was high but sensitivity was low. Lumbroso et al. observed morphologic changes of CNV vessels using OCTA over weeks after treatment with intra-vitreous anti‐VEGF injections, and noted alternating regression and progression phases.39
OCTA in choroiditis
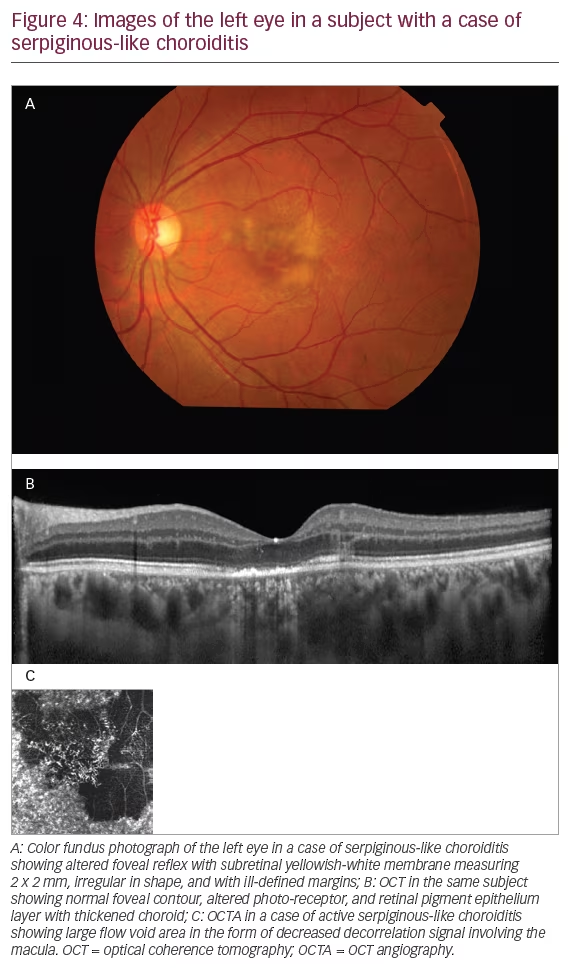
Choroiditis leads to chorio-retinal scar formation and is characterized with primary inflammation of the retinal pigment epithelium and choriocapillaris, and secondary involvement of the retina.40,41 ICGA is considered the test of choice for assessing active and healing choroiditis lesions, but being an invasive procedure it carries certain risks. OCTA can non-invasively provide features corresponding to ICGA during both the active and healing phases.42
There are very few studies in literature that have shown the features of choroiditis lesions on OCTA and have compared the features of active and healing lesions with ICGA both pre and post treatment. Mandadi et al. have described the comparative features of OCTA and ICGA in serpiginous-like choroiditis (SLC) both during and active and healing phases.43 In the active phase, SLC lesions on OCTA appear as areas of large flow void or decreased decorrelation signals corresponding to hypofluorescent area on ICGA at similar topographic locations. Simultaneously, in the healing phase these lesions appear as reduced areas of large flow void or reduced ‘decreased decorrelation signals’ corresponding to reduced hypofluorescent area on ICGA (Figure 4).44
OCTA in retinal vein occlusion
Retinal vein occlusions (RVOs) can lead to significant vision impairment. The major pathogenic effect is caused by macular edema and capillary non-perfusion. Thrombosis of the retinal vein, leading to variably impaired capillary perfusion and retinal ischemia is widely regarded as the underlying mechanism involved.45 OCT and FA play a major role in delineating these and also their extent and chronicity.
Various studies have reported OCTA findings in eyes with RVO.46–9 They showed that OCTA findings were consistent with clinical, anatomical, and FA findings including areas of impaired vascular perfusion, retinal atrophy, vascular dilation, shunt vessels, and some forms of intraretinal edema. FA only provides information about superficial capillary plexus, yet it has been documented with OCTA that the deeper capillary plexus is the predominant layer affected and is a clearer indicator of RVO pathogenesis as compared to superficial capillary plexus.
Panoramic OCTA
OCTA software can scan only a certain field of view in various sizes of cube based on examiner preference and on the location and size of pathology. The fields of view used most frequently are 3 x 3 mm and 6 x 6 mm. However, one can expand to a maximum of 9 x 9 mm and 10 x 10 mm. As the examiner selects the larger field of view, it is worth noting that the image resolution will decrease.3
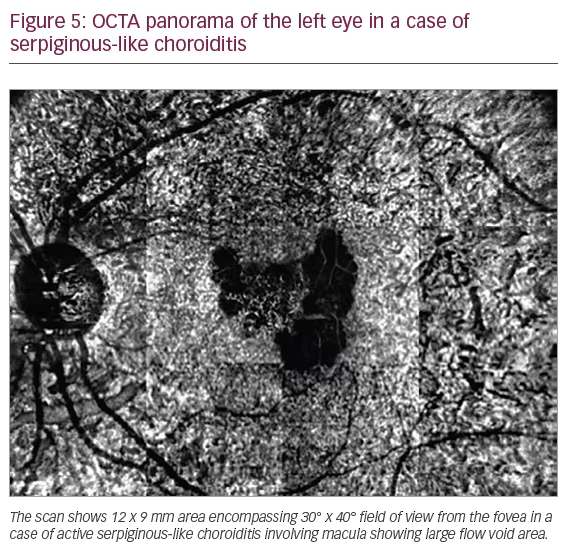
The AngioScan OCT-Angiography software on the RS-3000 Advance OCT allows clinicians to compose panoramic images with larger fields of view—12 x 9 mm, 9 x 9 mm, 6 x 6 mm, and 4.5 x 4.5 mm, providing, 40° x 30°, 30° x 30°, 20° x 20°, and 15° x 15° fields of view, respectively (Figure 5). In each of these sizes of fields of view, the software splits the scanning area into 3 x 3 mm cubes. The resolution obtained is therefore the same as that of an individual 3 x 3 mm cube provided by other software, but a larger field is simultaneously scanned at the same time. The large fields of view provided by panoramic imaging software enable us to non-invasively capture features previously seen only with FA. It also allows a real-time comparison with ICGA and FA images and is particularly useful to capture lesions in choroiditis, proliferative DR and various other diseases, allowing highest possible resolution at the same time.3
Limitations of OCTA and its role in clinical practice
OCTA is a nascent technology and is still in its infancy. There are several indications in which OCTA is better than, or equivalent to, accepted approaches, and many instances where it shows us findings that were unexpected. None of the older imaging modalities can be replaced by OCTA at present. This raises questions about the need for OCTA. Despite the potential benefits of OCTA, our expectations of technology must be tempered, given our limited experience.
There is a need to check for its validity and ability in terms of reproducibility of the data. This will require large multi‐centric, multi‐ethnic studies comparing this modality with FA, in order to better understand the significance. A major challenge is to develop automated, repeatable segmentation algorithms that reliably identify specific retinal vascular layers, even in diseased and poorly fixating eyes. OCTA is more prone to artifacts than FA. The larger superficial retinal vessels cause a ‘ghost image’ producing shadow artifacts when segmenting deeper layers, especially in the outer retina. This can make it more difficult to appreciate the presence of abnormal vasculature in deeper layers. Various artifacts in the form of dark lines and/or white lines may appear due to poor signal or obstruction of signal. Some non‐vascular structures, such as fine tissue, may also cause a decorrelation signal, especially if the patient is moving or poorly fixating. Finally, sub-optimal blood-flow through the lesions at the time of scan and poor correction for eye motion artifacts also account for artifacts, or poor scan. More importantly there is also a lack of common vocabulary among clinicians with regards to interpretation of OCTA images.
Finally, it remains unknown how the additional information gained from this technique can be used in routine clinical practice. However, it seems like OCTA is a truly disruptive technology. It is exciting and will probably change the approach of our practice of retinal diseases.
Summary
The need for non-invasive imaging modalities, along with developments in the field of biomedical engineering, led to the emergence of OCTA. The basic underlying principle is decorrelation, and it has several advantages over conventional invasive techniques such as FA and ICGA. Despite its unique features, its potential applicability is under observation and the development of this technology is continuously evolving. At the moment, it is certainly a potential supplementary tool to FA and ICGA, and an alternative, at times, for some pathologies; however, it needs to develop more with time and many long-term longitudinal studies are required to confirm its validity. Also, there is a lack of worldwide common vocabulary to understand the features among examiners and interpreters, but we are certainly looking at a very exciting new tool that has the potential to replace invasive tools with time and further development.
Future trends and conclusion
OCTA is a powerful tool and has enormous implications for understanding vascular perfusion, even in the absence of morphological changes. A flow index of the retina and optic nerve head can be used to ascertain perfusion compromise even before the presence of clinically visible signs. The novel, much improved eye tracking mechanism will pave a long way forward in achieving high-quality artifact-free scan images. A follow-up function has been provided that automatically selects the same layer that was designated during previous scans in order to allow a comparison at the very particular plane of retinal surface. This follow-up function will improve inter-observer and inter-session accuracy of tests. The further improvement in scanning speed protocols will allow the examiner to take a faster scan with similar accuracy. Use of swept-source technology on a large-scale basis will help analyze the deeper structures and will provide answers to many pathophysiological conditions in a non-invasive manner. In nut shell, the upcoming improvements in biomedical engineering will certainly allow us to go wider, deeper, faster, and to answer the unanswered.