Glaucoma is a progressive, multifactorial optic neuropathy characterised by acquired atrophy of the optic nerve due to the loss of retinal ganglion cells and their axons in the retina.1,2 Thus, evaluation of the retinal nerve fibre layer (RNFL) is key to diagnosing and monitoring changes in patients with glaucoma. Until recently, red-free fundus photographs were the clinical standard for evaluating the RNFL. Today, objective structural imaging instruments such as optical coherence tomography (OCT) are becoming standard for diagnosis and follow-up of glaucoma patients and glaucoma suspects.
The first OCT imaging studies of the human retina were reported in 1993.3,4 Since then, this technique has been rapidly adopted into clinical practice and is now one of the main diagnostic methods in ophthalmology.
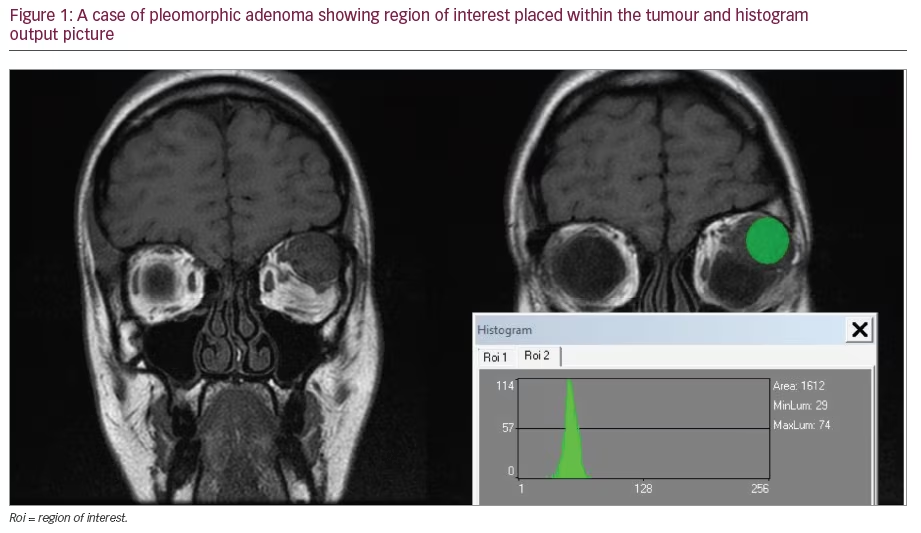
The performance of OCT has constantly improved since its introduction and the latest generation, spectral-domain OCT, provides 3D images with a higher axial resolution than the previous OCT version, time-domain OCT. Increased scanning speed (>25,000 A-scans/second) allows spectral-domain OCT to obtain a 3D cube of data, and advances in light source technology have significantly enhanced axial and transverse resolution. The cube of data enables a far more extensive assessment of the peripapillary area including temporal–superior–nasal–inferior–temporal (TSNIT) RNFL profiles, en face RNFL images (fundus image) and optic nerve head (ONH) assessment. OCT is the only non-invasive method that enables physicians to obtain in vivo high-resolution cross-sectional images of the retina (see Figure 1).
Structural damage in glaucoma is mainly evaluated by assessing the peri-papillary RNFL thickness and ONH morphology. Most commercially available OCTs include the option to measure RNFL thickness from a single 3.4mm-diameter circular scan centred on the optic disc. The instrument automatically calculates RNFL thickness as the distance between the vitreoretinal interface and the RNFL posterior boundary.5–7 However, very few OCTs also include a protocol for obtaining measurements of both the ONH and the RNFL in a single examination, because a high-density data sample must be scanned in order to support the different analyses (see Figure 2).
The diagnostic ability of time-domain OCT8–14 and the relationship between the results and visual field changes in glaucoma patients have been assessed.7,15 Similar assessments are now needed regarding the performance of the new spectral-domain OCTs. In this article, we review the recent literature and summarise the main findings related to spectral-domain OCT and glaucoma. The potential clinical impact of technological advances in OCT is also discussed.Discussion
Accurate and reproducibly measured diagnostic parameters allow investigators to precisely evaluate changes over time. Typically, parameters are compared with an age-matched normative database, and OCT performance is related to its measurement variability. Moreover, it is critical to understand the intra- and inter-test variability of each parameter when differentiating true changes in RNFL thickness from the instrument’s inherent variability. The greater the variability of the device, the greater the pathological change must be for the test to detect disease progression.
Schuman16 reported that, compared with earlier time-domain instruments, spectral-domain OCT has significantly better reproducibility in most RNFL sectoral measurements. These results were confirmed by Leung et al.,17 who compared the RNFL measurement variability obtained with a time-domain OCT (Stratus OCT; Carl Zeiss Meditec, Dublin, CA) and spectral-domain OCT (Cirrus HD-OCT; Carl Zeiss Meditec). Both types of OCT were used to evaluate 31 healthy subjects three times in separate visits within one month. Sixteen participants were also imaged with the Cirrus HD-OCT three times in a single visit to evaluate intra-visit reproducibility. In general, Cirrus HD-OCT had lower inter-visit measurement variability compared with the Stratus OCT, with significant differences at the 1, 3, 4 and 8–11 o’clock positions. The intra-visit reproducibility of the Cirrus HD-OCT was 5.1μm for the mean RNFL thickness and <10μm for the RNFL thickness at each of the four quadrants. The inter-visit reproducibility of Cirrus HD-OCT was similar to the intra-visit reproducibility. The coefficients of variation of the Cirrus HD-OCT and Stratus OCT measurements differed by a factor of two (about 6.4 and 12.8%, respectively). Intra-class correlation coefficients for the Cirrus HD-OCT were >0.92 for all parameters except RNFL thickness at the 9 o’clock position (0.88), and had higher numerical values compared with the Stratus OCT for almost all parameters (mean RNFL thickness 0.963 for the Cirrus and 0.866 for the Stratus). Variability was somewhat higher for clock-hour segments than for quadrants and mean RNFL thickness.
Other studies evaluating the reproducibility of time-domain OCT in healthy subjects and patients with glaucoma18,19 have reported results for the Stratus OCT similar to those of Leung et al.17 This improvement in reproducibility of spectral-domain OCT might be due to the capture of data cubes from which scan circles can be more reproducibly extracted. A second reason is the increased scanning speed. The excellent repeatability and reproducibility of spectral-domain OCT for peripapillary RNFL thickness measurements is sufficient to prove its usefulness for improving early diagnosis and monitoring of progression in patients with glaucoma.
Other authors have attempted to compare the ability of timeand spectral-domain OCT to differentiate between patients with and without glaucoma.16,17,20–22 Sung et al.20 found that the Cirrus HD-OCT classified more eyes with glaucomatous visual field defects as structurally outside normal limits and revealed higher sensitivity and specificity for the diagnosis of glaucoma based on its internal normative database. Nevertheless, most authors16,17,21,22 did not obtain evidence supporting a significantly better diagnostic ability of spectral-domain OCT for the diagnosis of glaucoma. Moreno-Montañés et al.21 compared measurements by the two OCT generations and their ability to discriminate glaucomatous eyes having visual field loss. Although they did not find significant differences for the areas under the receiver operating characteristic curve (AUC), the Cirrus OCT-HD had a generally higher sensitivity at fixed specificity values: the ROC curve shows the trade-off between sensitivity and 1 – specificity (false-positive rate). An AUC of 1.0 represents perfect discrimination, whereas an AUC of 0.5 represents chance discrimination.
In a study by Leung et al.17 the largest AUCs for Cirrus HD-OCT were 0.962 (95% confidence interval [CI] 0.923–0.985) for mean RNFL thickness and 0.963 (95% [CI] 0.924–0.985) for superior quadrant thickness. Chang et al.22 observed an equivalent sensitivity and specificity of the Stratus and Cirrus HD -OCT for diagnosing glaucoma with early and moderate visual field defects. Time- and spectraldomain OCTs produced comparable AUCs in careful hands, but spectral-domain OCT may have advantages in clinical settings because it seems to be less dependent on operator diligence and skill.
Other authors23 evaluated and compared the ability of the two OCT systems to discriminate between healthy subjects and patients with normal visual fields and wedge-shaped RNFL defects assessed by red-free fundus photographs. The best AUCs were observed for measurements of RNFL thicknesses at the vertical axis of the ONH (superior and inferior clock-hour positions). No significant differences were detected between the AUCs of the equivalent parameters of both devices, thus the Stratus and Cirrus OCTs were determined to have similar potential ability for pre-perimetric glaucoma diagnosis.
Differing study designs, inclusion and exclusion criteria and levels of damage in visual field defects make it difficult to compare the results among studies. Obviously, the severity of visual field loss has an important impact on imaging instrument sensitivity. Leite et al.24 evaluated the effect of disease severity on the diagnostic accuracy of the Cirrus HD-OCT for glaucoma detection. More severe disease was associated with increased sensitivity. For mean RNFL thickness, AUCs were 0.962, 0.932, 0.886 and 0.822 for visual field index (VFI)25 values of 70, 80, 90 and 100%, respectively. In populations of patients with moderate or severe visual field loss, one would expect a higher sensitivity–specificity balance.
All articles17,20,21,26,27 comparing the measurements acquired with Stratus and Cirrus HD-OCT reported evidence of differences in RNFL thickness values and normative classification. For example, the Cirrus HD-OCT demonstrated higher sensitivity (63.6%) and specificity (100%) than the Stratus OCT (40.0 and 96.7%, respectively) in normative classification of mean RNFL thickness.20 Although strongly correlated, (r=0.94; p<0.001), the Cirrus and Stratus RNFL thickness measurements were significantly different and could not be used inter-changeably. Although qualitative agreement between the two instruments is good,20,26 differences in the signal characteristics and RNFL border segmentation algorithms lead to RNFL thickness values that are not directly inter-changeable. Clinicians should be aware that measurements are generally higher when obtained with the Stratus than with the Cirrus HD-OCT, except when the RNFL is very thin, as in severe glaucoma.27 The Stratus minus Cirrus difference is proportional to the RNFL thickness. For thinner RNFLs, the Stratus measurements tend to be thinner than the Cirrus measurements, whereas for thicker RNFL thicknesses, Stratus measurements tend to be thicker than Cirrus measurements. Nevertheless, these differences can be minimised by matching scan locations.28 A limitation of the 3.4mm-diameter circle scan of the time-domain OCT is that results can differ from scan to scan because scan circle placement is operator-dependent. Moreover, sampling points can be scattered along the 3.4mm-diameter circle due to eye motion. Kim et al.28designed a matching algorithm to make time-domain OCT circular scan RNFL thickness measurements comparable to those from 3D spectral-domain OCT volumes. They observed that the RNFL thickness differences were significantly smaller when the scanning circle centre location between the two OCT generations was matchedthan when it was not matched. Scan location matching may allow for follow-up comparability across the two OCT generations.
Conclusions
Spectral-domain OCT provides many potential advantages for glaucoma diagnosis and follow-up. The axial resolution of commercially available units is currently close to 5μm, and research systems are approaching 2–3μm, which could lead to the detection of subtle changes in the RNFL and the optic disc and result in a better ability to detect disease progression (see Figure 3). Moreover, the higher scan acquisition speed reduces artefacts and might help to obtain more accurate measurements, which also contributes to reduced measurement variability.
Higher image resolution will allow for improved segmentation of the retinal layers, leading to more accurate measurements. Focal loss of tissue, which occurs more often in the earlier stages of glaucoma, may be easier to identify. Thus, spectral-domain OCT can potentially acquire a greater sensitivity for early glaucoma diagnosis.
3D images offer the possibility of moving the scan circle on the surface of the scanned cube without the necessity of performing a new examination. The wealth of information contained in a 3D data cube allows for evaluation of the RNFL and ONH morphology all in the same scan. Moreover, optic disc parameters are more precise because much less interpolation between adjacent points is necessary than in time-domain OCT.
All these characteristics of spectral-domain OCT should result in better diagnostic ability and increased capability to detect disease progression compared with time-domain OCT. In fact, spectraldomain OCT has already demonstrated an improved reproducibility in peri-papillary measurements over the previous clinical standard for OCT.16,17 Nevertheless, although the current studies16,17,21,22 do not provide evidence for a better glaucoma discrimination ability for spectral-domain OCT, better performance is expected as image analysis software improves.
This technology may help to elucidate retinal biology and the pathogenesis of retinal and optic disc diseases, such as glaucoma or age-related macular degeneration, which are the leading causes of visual impairment worldwide. OCT is already being used to evaluate the effect of new medical treatments such as the effect of anti-angiogenic agents in the management of macular disease. In the same way, OCT may be useful for monitoring the effect of different therapeutic approaches focused on preventing the progression of glaucoma.
More studies are needed to confirm that the improvements obtained in the most recent generation of OCTs will have a clinically relevant and positive impact in clinical practice.