touchOPHTHALMOLOGY touchOPHTHALMOLOGY
Imaging
Read Time: 10 mins

Imaging of the Human Fundus in the Clinical Setting: Past, Present and Future

Copy Link
Published Online: Apr 19th 2013 US Ophthalmic Review, 2013;6(1):42–7 DOI: http://doi.org/10.17925/USOR.2013.06.01.42
Authors: Dr. Antonio Calcagni, Professor Jonathan Gibson
Quick Links:
Abstract
Article
Article Information
Abstract:
Overview

The human fundus is a complex structure that can be easily visualized and the world of ophthalmology is going through a golden era of new and exciting fundus imaging techniques; recent advances in technology have allowed a significant improvement in the imaging modalities clinicians have available to formulate a diagnostic and treatment plan for the patient, but there is constant on-going work to improve current technology and create new ideas in order to gather as much information as possible from the human fundus. In this article we shall summarize the imaging techniques available in the standard medical retina clinic (i.e. not limited to the research lab) and delineate the technologies that we believe will have a significant impact on the way clinicians will assess retinal and choroidal pathology in the not too distant future.

Keywords

Adaptive optics, autofluorescence, confocal scanning laser ophthalmoscope, fluorescein angiography, indocyanine green angiography, multispectral, ophthalmoscopy, optical coherence tomography, retinal imaging, retinal oximetry, retro-mode imaging, wide-angle

Article:

Introduction


Introduction
‘In the whole history of Medicine there is no more beautiful episode than the invention of the ophthalmoscope’1 is how the introduction into clinical practice of this fundamental instrument was greeted. The invention of the ophthalmoscope by von Helmholtz in 1851 triggered a cascade of other innovations and data analysis tools that has led to an increasingly accurate assessment of patients with retinal disease. In the twenty-first century amongst other techniques, ophthalmologists have access to a vast array of equipment and technology to image the fundus including the slit-lamp, fundus cameras, fundus fluorescein angiography (FFA), indocyanine green angiography (ICG), fundus autofluorescence (FAF), optical coherence tomography (OCT). Furthermore, this technology is constantly being updated as new instruments are designed.

In this article, the authors will summarize the techniques currently available in the standard clinical setting to image the human fundus and investigate the use of other exciting imaging modalities that are appearing on the horizon of the medical retina clinic and which the authors believe are destined to increase the ophthalmologist’s diagnostic armamentarium.

Background
The ocular fundus is a complex multi-layered structure2 that can be analyzed by several techniques: when light strikes the fundus, it can be reflected, absorbed, scattered, transmitted, or remitted, depending on the wavelength of incident light and tissue histology: image formation is determined by the amount of each wavelength reflected. Structural changes will cause localized variations in light/tissue interaction, with consequent variations in the amount of light reflected, and this will affect some wavelengths more than others, sometimes with specific patterns depending on the pathology in question.

The first published photographs of in-vivo human retina used a camera fixed to the subject’s head and a 2.5 minute exposure.3 Since then, major advances have been made in fundus imaging, including short exposure photography without movement artefacts and high resolution real-time digital color fundus photography, which produce high quality fundus images, nowadays frequently taken for granted. In addition, FFA and ICG, that have become part of the routine practice in the medical retina clinics, allow dynamic investigation of the retinal and choroidal circulation.

The rapid advances in computer technology and the digital photography revolution have directly led to techniques like OCT and FAF, which are deepening our understanding of retinal/choroidal pathology.

The Present
Color Fundus Photography
Three wavelength (red-green-blue or RGB) fundus photography provides the basis for color fundus photography, which has an important role in the diagnosis and monitoring of retinal conditions. For diabetic retinopathy photography, the standard technique for many years has been the seven field (stereo) technique, which still forms the gold-standard of disease monitoring in clinical trials.4

However, the difficult and time consuming nature of this technique for patients and staff makes it impractical for large-scale population screening of diabetic retinopathy. The EURODIAB IDDM complications study therefore validated the method of using two fundus photographs, centred on the optic disc and macula respectively5; this has now formed the basis for the English National Diabetic Retinopathy Screening Programme,6 which offers annual digital fundus photographic screening of all persons with diabetes in England. The scheme uses remote grading of fundus photographs and has built in extensive quality controls to ensure safety and cost-effectiveness.

Fundus Fluorescein Angiography and Indocyanine Green Angiography
Fundus fluorescein angiography and ICG are dynamic investigations of the fundus circulations in the retina and choroid and have provided entirely new insights into the pathophysiology of fundus diseases. Both techniques rely on the fact that fluorescein and indocyanine green dyes, once they have absorbed a specific exciting wavelength (465–90 nm and 790–805 nm respectively), remit a different wavelength (520–30 nm and 825–35 nm) that can be photographed by a fundus camera fitted with appropriate filters.7-9

In the case of FFA this is light in the yellow-green part of the spectrum, whist for ICG the fluorescence is in the non-visible, infrared area of the spectrum.

Fundus Autofluorescence
Autofluorescence is the ability of a substance to absorb light of a particular wavelength and emit a longer wavelength, without any additional dyes. This phenomenon is classically seen in cases of optic disc drusen,10 photographed with a fluorescein angiography camera but without fluorescein dye being injected. Autofluorecscence in the retinal pigment epithelium (RPE) has been known for many years from histological studies,11,12 however the use of in vivo FAF measurement is relatively recent.13,14 FAF is mainly due to lipofuscin granules in the RPE,15 which are a manifestation of the viability of cell metabolism; excessive FAF can be a consequence of a ‘sick’ RPE, incapable of clearing all the lipofuscin present, or accumulation of excessive amounts of lipofuscin production; reduced FAF, which appears dark or even black on FAF imaging, is usually an indication of severe loss of the RPE.16 Detection of FAF can be obtained either with a confocal scanning laser ophthalmoscope17 or with a modified fundus camera18 and numerous studies have demonstrated the usefulness of FAF imaging in the assessment of subjects with loss of vision and the presence of distinctive patterns of FAF change in certain fundus disorders.16,19-28

The use of FAF has also been expanded by using dual wavelength autofluorescence, a technique pioneered by Delori and especially useful in the measurement of macular pigment optical density.29,30

Optical Coherence Tomography
Optical Coherence Tomography (OCT) provides a cross sectional analysis of the fundus (optical biopsy),31,32 and has heralded a new era in retinal imaging. In recent years the full potential of this technique is beginning to be appreciated, to a point that new classifications and descriptions of pathologies are being introduced based on OCT findings. Time domain OCTs have been replaced by the higher quality spectral domain (SD -) OCTs33 that allow resolution to around 5–10 microns and are much faster thereby reducing motion artefacts and improving patient compliance.34,35

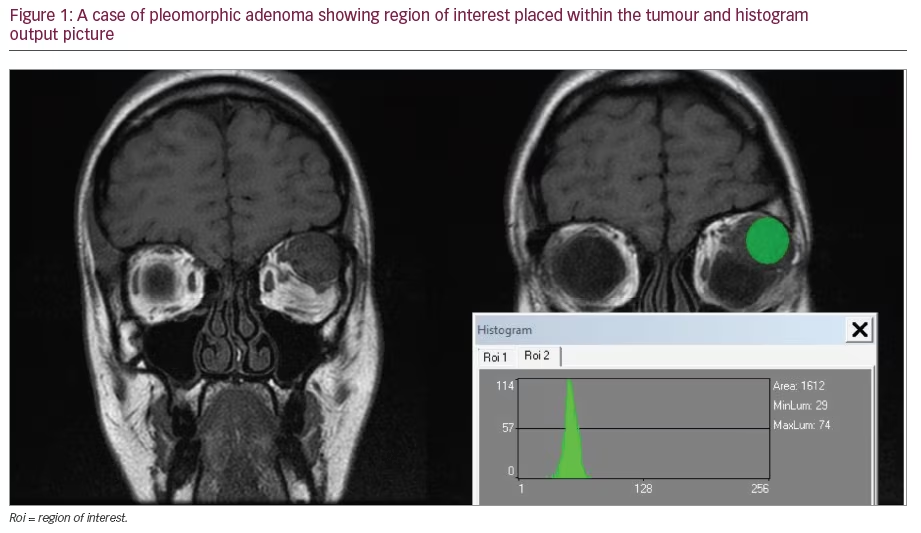
In figure 1, a case of acute macular neuroretinopathy (AMN) is shown: the characteristic petalloid abnormalities are evident on the fundus image generated by infrared wavelengths, with corresponding disturbance of the inner segment-outer segment junction on the OCT (arrow heads); the localization on OCT of the structural abnormalities in the outer retina has prompted some authors to rename this condition acute macular outer retinopathy (AMOR).36

From a clinical perspective, SD-OCT has become a valuable tool in the diagnosis and monitoring of retinal conditions and has become a major part of the assessment of retinal morphology and treatment decision in the management of neovascular age-related macular degeneration (AMD), diabetic macular oedema and retinal vein occlusions.

Ultra-high resolution OCT has now also been developed,37,38 and it is likely that improved resolution in future OCT machines will permit resolution at the level of individual photoreceptors.39 However whether this improved resolution will prove to be clinically useful remains to be seen. It is also important to realize the limitations of current OCT and to remember that OCT does not replace careful fundus examination. An example of this is the detection of small points of subretinal hemorrhage on fundus examination, which is a crucial finding in patients undergoing treatment with anti-VEGF agents , as it might warrant further treatment but may be invisible on OCT alone.

A further application of SD-OCT is enhanced depth imaging (EDI), a method to obtain better quality images of the choroid and evaluate its thickness.40,41 We are now beginning to better understand the functions of the choroid and it is evident it contributes to the metabolic integrity of the retinal pigment epithelium and of the retina, acts as a ‘dark room’ by absorbing excess light reaching the retina, partly supplies blood to the pre-laminar portion of the optic nerve, and is thought to act as a ‘heat sink’, allowing dissipation of thermal energy produced by the high metabolic rate of the retinal structures.2,38,42-46 Any pathology affecting the choroid will therefore also alter the metabolism of the retina, RPE and optic nerve. Therefore imaging and evaluation of the choroid is likely to be increasingly important as we look to understand fundus pathology.47-51 Modern equipment has inbuilt modules to automatically obtain EDI; however with older machines, equivalent measurements can be made by simply positioning the equipment close enough to the eye to obtain an inverted fundus image 40 (100 averaged scans gives the best quality cross-sections). Wide-field Fundus Photography Several pathologies affect primarily the fundus periphery and a full retinal assessment can only be carried out by indirect ophthalmoscopy and scleral depression, which are time-consuming and frequently uncomfortable for the patient. Retinal ischemia is best characterized with fluorescein angiography; traditional FFA employs retinal photography able to view approximately 30° of the retina at one time. The Early Treatment Diabetic Retinopathy Study (ETDRS) developed the seven-standard fields (7SF) protocol in which seven photographed areas of the retina were combined to give nearly 75° of visualization.4

With the advent of ultra-widefield fluorescein angiography (UWFFA),52-54 it is possible to image up to 200° of retina (see Figure 2); furthermore the Optos cameras (Optos PLC, Dunfermline) incorporate low-powered laser wavelengths in the green and red parts of the spectrum, allowing visualization from the neurosensory retina to beyond the RPE, into the choroid.

Initial small-scale studies have shown that UWFFA is useful in detecting capillary non-perfusion in patients with diabetic retinopathy, both proliferative and with diabetic macular oedema, which is better than other methods with a more limited degree of retinal imaging.55

Ultra-widefield fluorescein angiography opens up the possibility of targeting laser photocoagulation to areas of capillary closure which might be more effective and less damaging than conventional pan-retinal laser photocoagulation.

It must be remembered however that wide-field fundus imaging has limitations and it cannot, at present, replace indirect ophthalmoscopy with scleral indentation for detecting peripheral retinal breaks; furthermore, at present it is not advocated for diabetic retinopathy screening.

However continuing refinement of this technology means that wide field fundus imaging is likely to play an increasingly important role in the eye clinic of the future.

The Future
In this section, the authors tackle several techniques they believe will eventually make their way into routine clinical practice.

Retinal Oximetry
Retinal oximetry56–58 is based on the spectroscopic measurement of blood within the retinal vessels and it exploits the different spectral characteristics of oxygenated (HbO2) versus deoxygenated hemoglobin (Hb). In this way, it has been used to plot out oxygenation maps of the fundus and correlate this in different retino-vascular pathologies.59 Hypoxia is believed to play a fundamental role in several retinal pathologies: it is not surprising therefore that the possibility to measure retinal oxygenation has been increasingly popular in the ophthalmology research world.60-81 There are numerous techniques currently under investigation to establish the best suited for clinical practice and it is highly likely that a tool to this scope will make its way into the standard retinal clinics in the not too distant future.

Retro-mode imaging
The F-10 (Nidek, Japan) is a confocal scanning laser ophthalmoscope (SLO) which non-invasively scans the fundus with a Class 1 laser. Different modes of imaging include reflectance modes for various wavelengths (490nm, 532 nm, 660 nm and 790 nm), fluorescein angiography, indocyanine green angiography and a novel technique, retro-mode.

Retro-mode imaging uses an infrared laser (wavelength 790 nm) and employs an aperture with a modified central stop, which is deviated laterally from the confocal light path, and may be positioned to the left or right side of the fundus. The scattered light passing through the deviated aperture gives a shadow to features such as subretinal deposits thus enhancing the contrast and delineation of these features. (see Figure 3) Retro-mode images have demonstrated that they are an extremely sensitive means of monitoring retinal drusen and can measure size changes over small time periods. This technique may prove to be a useful means of monitoring retinal drusen in cases of AMD and evaluate future interventional therapies.82

Time-based autofluorescence and Functional Optical Coherence Tomography
Pathology affects metabolism before structural changes occur83 and at this early stage of disease, alterations are usually still reversible. It is believed substances like FAD, NADH, lipofuscin, collagen, elastin, and glycation end products are of fundamental importance in metabolic processes of disease;84 all these substances are considered fluorophores, i.e. substances that emit some form of spectral radiation when exposed to light, and each is characterized by a specific absorption spectrum, emission spectrum and life-time of the fluorescence (fluorescence decay time) once stimulated; this last characteristic is of particular interest, as each fluorophore has a specific fluorescence decay time, which is not influenced by the concentration of the fluorophore itself nor the surrounding tissue;83-87 therefore different fluorophores can be differentiated as those emitting with the same fluorescence can be discriminated from each other by fluorescence intensity and decay time.

In Figure 4 (courtesy of Professor Dietrich Schweitzer) a comparison between time-based autofluorescence of a healthy individual (a and b) and a subject with AMD (c and d) is demonstrated. In the left column, the lifetimes of autofluorescence in picoseconds are featured, whereas the left column is an indication of autofluorescence intensity. It is evident that the intensity and decay time of autofluorescence are different between the two.

By combining measurements of the fluorescence decay time with optical coherence tomography, it should be possible to generate a ‘functional OCT’. Time and spectrally resolved measurements of autofluorescence have the potential to monitor metabolism at the cellular level; it will be possible to assess functionality of single retinal layers or of different retinal areas, possibly paving the way to localized treatment: for example, in the context of diabetic retinopathy, it may be possible to identify, non-invasively, areas of the retina that will eventually trigger new vessel formation due to hypo-perfusion (which causes abnormal metabolism), allowing localized laser photocoagulation to be applied only in that specific area, before the new vessels develop.

Adaptive Optics
The resolution of current fundus imaging equipment is mainly limited by the optical aberrations within the eye.39,88,89 One of the most promising advances in this field is adaptive optics (AO),39,90-94 a technique developed in astronomy to remove the effect of atmospheric turbulence from telescope images, that has also been adapted to be used in the human eye. One application has been to obtain high resolution images of the retina, in ultra-high resolution OCT machines, allowing the resolution of individual photoreceptors and other retinal cells in vivo.39,92,94,95 This may translate to widespread clinical use in a number of macular disorders such as AMD, where early intervention is crucial.

The combination of AO with optical coherence tomography (OCT) has permitted cones to be resolved in vivo in great detail39 and the concept of individual cone imaging is now realistic. Whether this will lead to better and earlier treatments remains to be seen.

Multispectral Fundus Imaging
Light/tissue interaction is governed by tissue histology and wavelength of incident light; therefore the distribution, quantities and characteristic optical absorption properties of the fundus pigments and the spectral properties of the light used to illuminate the fundus will determine its appearance during fundoscopy/fundus imaging. It is therefore theoretically possible to recover tissue histology from images, providing the optical properties of each tissue component and the optical spectrum of the light source are known.

Conventional red-green-blue (RGB) digital images give good spatial resolution, but low spectral resolution, thus making truly accurate histological interpretation of the tissue practically impossible. On the other hand, traditional tissue spectroscopy allows a detailed characterization of a single point, but large areas of tissue cannot be examined.

Multispectral imaging combines the advantages of both techniques, allowing detailed spectral analysis of a large area; this is achieved by superimposing a number of images taken using a predetermined set of narrow-band filters, which provide the desired level of spectral detail.

It is interesting to note how the various researchers interpret their images to obtain the desired information, from comparison of two96,97 or more59,98,99 reflected wavelengths; yet more complex is the use of a computergenerated reflectance model of the fundus at every wavelength in the visible spectrum and comparison of the fundus images to the model.100-104

In Figure 5, images from an eye with mild scarring (difficult to see on fundoscopy) secondary to inactive choroidal neovascular membrane previously treated with intravitreal ranibizumab, are shown; each image represents different wavelengths (507 nm, 525 nm, 552 nm, 585 nm, 596 nm, and 611 nm) and the area of fibrosis (arrow) can be differentiated from other abnormalities based on its different spectral characteristics, i.e. the fact that it is more visible at certain wavelengths compared to others.

The amount of information yielded from multispectral images is by far greater than that from standard (RGB) fundus photography and this technique is bound to develop further, as technology develops and allows simultaneous higher resolution images at multiple wavelengths to be acquired.

Conclusion
The world of ophthalmology is going through a golden era of fundus imaging. It is likely that the above described techniques and others will be combined in ever more sophisticated instruments, allowing clinicians to formulate an increasingly personalized diagnostic, therapeutic and prognostic plan for each individual. As technology develops, ophthalmologists will need to flexibly incorporate these new imaging technologies into their practice , to ensure patients continue to receive the best care.

Article Information:
Disclosure

The authors have no conflicts of interest to declare.

Correspondence

Jonathan Gibson, School of Life and Health Sciences, Aston University, Birmingham, B4 7ET, UK. E: j.m.gibson@aston.ac.uk

Received

2012-10-23T00:00:00

References

  1. Loring EG, Text-Book of Ophthalmology,Part 1. London, England Henry Kimpton; 1892.
  2. Snell RS, Lemp MA, Clinical anatomy of the eye. 2nd ed. Malden, MA, USA: Blackwell Science; 1998.
  3. Mann WA, History of photography of the eye,Survey of Ophthalmology,1970;15(3):179–89.
  4. Grading diabetic retinopathy from stereoscopic color fundus photographs--an extension of the modified Airlie House classification, ETDRS report number 10, Early Treatment Diabetic Retinopathy Study Research Group, Ophthalmology, 1991;98(5 Suppl):786–806.
  5. Aldington SJ, Kohner EM, Meuer S, et al., Methodology for retinal photography and assessment of diabetic retinopathy: the EURODIAB IDDM complications study, Diabetologia, 1995;38(4):437–44.
  6. Sharp PF, Olson J, Strachan F, et al., The value of digital imaging in diabetic retinopathy, Health technology assessment 2003;7(30):1–119.
  7. Chao P, Flocks M, The retinal circulation time, American Journal of Ophthalmology,1958; 46(1, Part 2): 8–10.
  8. Fox IJ, Wood EH, Indocyanine green: physical and physiologic properties, Proc Staff Meetings Mayo Clin, 1960;35:732–44.
  9. Gass JDM, Stereoscopic atlas of macular diseases: diagnosis and treatment, 3rd ed, St. Louis: Mosby; 1987.
  10. Bonnin P, Passot, Triolaire-Cotten T, [Autofluorescence of papillary drusen in the diagnosis of false papillary edema], Bulletin des societes d’ophtalmologie de France 1976;76(4):331–5.
  11. Porta EA, Hartroft WS, Lipid pigments in relation to aging and dietary factors (lipofuscin). In: Wolman M, ed. Pigments in Pathology, New York: Academic Press,Inc;1969:192–236.
  12. Katz ML, Stone WL, Dratz EA, Fluorescent pigment accumulation in retinal pigment epithelium of antioxidantdeficient rats, Investigative Ophthalmology & Visual Science, 1978;17(11):1049–58.
  13. Kitagawa K, Nishida S, Ogura Y, In vivoquantitation of autofluorescence in human retinal pigment epithelium, Ophthalmologica Journal international d’ophtalmologie [International journal of ophthalmology] Zeitschrift fur Augenheilkunde, 1989;199(2–3):116–21.
  14. Delori FC, Spectrophotometer for noninvasive measurement of intrinsic fluorescence and reflectance of the ocular fundus, Applied optics, 1994;33(31):7439–52.
  15. Delori FC, Dorey CK, Staurenghi G, et al., In vivofluorescence of the ocular fundus exhibits retinal pigment epithelium lipofuscin characteristics, Investigative Ophthalmology & Visual Science,1995; 36(3):718–29.
  16. Schmitz-Valckenberg S, Holz FG, Bird AC, Spaide RF, Fundus autofluorescence imaging: review and perspectives, Retina, 2008; 28(3): 385–409.
  17. von Ruckmann A, Fitzke FW, Bird AC, Distribution of fundus autofluorescence with a scanning laser ophthalmoscope, The British Journal of Ophthalmology, 1995;79(5):407–12.
  18. Spaide RF, Fundus autofluorescence and age-related macular degeneration, Ophthalmology, 2003;110(2):392–9.
  19. von Ruckmann A, Fitzke FW, Bird AC, In vivofundus autofluorescence in macular dystrophies, Archives of Ophthalmology, 1997;115(5):609–15.
  20. von Ruckmann A, Fitzke FW, Bird AC, Fundus autofluorescence in age-related macular disease imaged with a laser scanning Ophthalmoscope, Investigative Ophthalmology & Visual Science, 1997;38(2):478–86.
  21. von Ruckmann A, Schmidt KG, Fitzke FW, et al., [Studies of the distribution of lipofuscin in the retinal pigment epithelium using high-resolution TV laser scanning ophthalmoscopy], Der Ophthalmologe: Zeitschrift der Deutschen Ophthalmologischen Gesellschaft,1998;95(10):699–705.
  22. von Ruckmann A, Schmidt KG, Fitzke FW, et al., [Fundus autofluorescence in patients with hereditary macular dystrophies, malattia leventinese, familial dominant and agedrelated drusen], Klinische Monatsblatter fur Augenheilkunde 1998;213(2):81–6.
  23. von Ruckmann A, Schmidt KG, Fitzke FW, et al., [Dynamics of accumulation and degradation of lipofuscin in retinal pigment epithelium in senile macular degeneration], Klinische Monatsblatter fur Augenheilkunde, 1998;213(1):32–7.
  24. von Ruckmann A, Schmidt KG, Fitzke FW, et al., [Serous central chorioretinopathy. Acute autofluorescence of the pigment epithelium of the eye], Der Ophthalmologe: Zeitschrift der Deutschen Ophthalmologischen Gesellschaft ,1999;96(1):6–10.
  25. von Ruckmann A, Fitzke FW, Bird AC, Distribution of pigment epithelium autofluorescence in retinal disease state recorded in vivoand its change over time. Graefe’s archive for clinical and experimental ophthalmology = Albrecht von Graefes Archiv fur klinische und experimentelle Ophthalmologie, 1999;237(1):1–9.
  26. von Ruckmann A, Fitzke FW, Fan J, et al., Abnormalities of fundus autofluorescence in central serous retinopathy, American Journal of Ophthalmology,2002;133(6):780–6.
  27. Bindewald A, Bird AC, Dandekar SS, et al., Classification of fundus autofluorescence patterns in early age-related macular disease, Investigative Ophthalmology & Visual Science, 2005;46(9):3309–14.
  28. Delori FC, Staurenghi G, Arend O, et al., In vivomeasurement of lipofuscin in Stargardt’s disease--Fundus flavimaculatus. Investigative Ophthalmology & Visual Science, 1995;36(11):2327–31.
  29. Delori FC, Goger DG, Hammond BR, et al., Macular pigment density measured by autofluorescence spectrometry: comparison with reflectometry and heterochromatic flicker photometry, Journal of the Optical Society of America A, Optics, Image Science, and Vision,2001;18(6):1212–30.
  30. Delori FC, Autofluorescence method to measure macular pigment optical densities fluorometry and autofluorescence imaging, Archives of Biochemistry and Biophysics 2004;430(2):156–62.
  31. Huang D, Swanson EA, Lin CP, et al., Optical coherence tomography, Science,1991;254(5035):1178–81.
  32. Fercher AF, Hitzenberger CK, Drexler W, et al., In vivooptical coherence tomography, American Journal of Ophthalmology, 1993;116(1):113–4.
  33. Chang RT, Knight OJ, Feuer WJ, Budenz DL, Sensitivity and specificity of time-domain versus spectral-domain optical coherence tomography in diagnosing early to moderate glaucoma, Ophthalmology,2009;116(12):2294–9.
  34. Drexler W, Fujimoto JG, State-of-the-art retinal optical coherence tomography, Progress in retinal and eye research, 2008;27(1):45–88.
  35. Marschall S, Sander B, Mogensen M, Et al., Optical coherence tomography-current technology and applications in clinical and biomedical research, Analytical and Bioanalytical Chemistry2011;400(9):2699–720.
  36. Yeh S, Hwang TS, Weleber RG, Et al., Acute macular outer retinopathy (AMOR): a reappraisal of acute macular neuroretinopathy using multimodality diagnostic testing, Archives of Ophthalmology,2011;129(3):365–8.
  37. Drexler W, Sattmann H, Hermann B, et al., Enhanced visualization of macular pathology with the use of ultrahighresolution optical coherence tomography, Archives of Ophthalmology2003;121(5):695–706.
  38. Leitgeb R, Schmetterer L, Drexler W, et al., Real-time assessment of retinal blood flow with ultrafast acquisition by color Doppler Fourier domain optical coherence tomography, Optics Express, 2003;11(23):3116–21.
  39. Kocaoglu OP, Lee S, Jonnal RS, et al., Imaging cone photoreceptors in three dimensions and in time using ultrahigh resolution optical coherence tomography with adaptive optics, Biomedical Optics Express,2011;2(4):748–63.
  40. Spaide RF, Koizumi H, Pozzoni MC, Enhanced depth imaging spectral-domain optical coherence tomography, American Journal of Ophthalmology, 2008;146(4):496–500.
  41. Margolis R, Spaide RF, A pilot study of enhanced depth imaging optical coherence tomography of the choroid in normal eyes. American journal of ophthalmology,2009;147(5):811–5.
  42. Hayreh SS, Blood supply of the optic nerve head and its role in optic atrophy, glaucoma, and oedema of the optic disc, The British Journal of Ophthalmology,1969;53(11):721–48.
  43. Hayreh SS, Vrabec F, The structure of the head of the optic nerve in rhesus monkey, American Journal of Ophthalmology, 1966;61(1):136–50.
  44. Kang Derwent J, Linsenmeier RA, Effects of hypoxemia on the a- and b-waves of the electroretinogram in the cat retina, Investigative Ophthalmology & Visual Science, 2000;41(11):3634–42.
  45. Linsenmeier RA, Padnick-Silver L, Metabolic dependence of photoreceptors on the choroid in the normal and detached retina, Investigative Ophthalmology & Visual Science, 2000;41(10):3117–23.
  46. Parver LM, Auker C, Carpenter DO, Choroidal blood flow as a heat dissipating mechanism in the macula, American Journal of Ophthalmology, 1980;89(5):641–6.
  47. Fujiwara T, Imamura Y, Margolis R, et al., Enhanced depth imaging optical coherence tomography of the choroid in highly myopic eyes, American Journal of Ophthalmology, 2009;148(3):445–50.
  48. Imamura Y, Fujiwara T, Margolis R, Spaide RF, Enhanced depth imaging optical coherence tomography of the choroid in central serous chorioretinopathy, Retina,2009;29(10):1469–73.
  49. Imamura Y, Iida T, Maruko I, et al., Enhanced depth imaging optical coherence tomography of the sclera in domeshaped macula, American Journal of Ophthalmology, 2011;151(2):297–302.
  50. Spaide RF, Enhanced depth imaging optical coherence tomography of retinal pigment epithelial detachment in age-related macular degeneration, American Journal of Ophthalmology, 2009;147(4):644–52.
  51. Spaide RF, Akiba M, Ohno-Matsui K, Evaluation of peripapillary intrachoroidal cavitation with swept source and enhanced depth imaging optical coherence tomography, Retina, 2012;32(6):1037–44.
  52. Staurenghi G, Viola F, Mainster MA, et al., Scanning laser ophthalmoscopy and angiography with a wide-field contact lens system, Archives of Ophthalmology, 2005;123(2):244–52.
  53. Manivannan A, Plskova J, Farrow A, et al., Ultra-wide-field fluorescein angiography of the ocular fundus, American Journal of Ophthalmology,2005;140(3):525–7.
  54. Ciardella A, Brown D, Wide field imaging, In: Agarwal A, ed. Fundus Fluorescein and Indocyanine Green Angiography: A Textbook and Atlas,New York: Slack Inc.;2007:79–83.
  55. Wessel MM, Nair N, Aaker GD, et al., Peripheral retinal ischaemia, as evaluated by ultra-widefield fluorescein angiography, is associated with diabetic macular oedema, The British Journal of Ophthalmology,2012;96(5):694–8.
  56. Heitmar R, Safeen S, Regional differences in oxygen saturation in retinal arterioles and venules, Graefe’s archive for clinical and experimental ophthalmology = Albrecht von Graefes Archiv fur klinische und experimentelle Ophthalmologie, 2012.
  57. Heitmar R, Summers RJ, Assessing vascular function using dynamic retinal diameter measurements: a new insight on the endothelium, Thrombosis and haemostasis, 2012;107(6):1019–26.
  58. Hardarson SH, Harris A, Karlsson RA, et al., Automatic retinal oximetry,Investigative Ophthalmology & Visual Science, 2006;47(11):5011–6.
  59. Mordant DJ, Al-Abboud I, Muyo G, et al., Validation of human whole blood oximetry, using a hyperspectral fundus camera with a model eye, Investigative Ophthalmology & Visual Science, 2011;52(5):2851–9.
  60. Yang Y, Zhu XR, Xu QG, et al., Magnetic resonance imaging retinal oximetry: a quantitative physiological biomarker for early diabetic retinopathy?, Diabetic Medicine: a Journal of the British Diabetic Association, 2012;29(4):501–5.
  61. Palsson O, Geirsdottir A, Hardarson SH, et al., Retinal oximetry images must be standardized: a methodological analysis, Investigative Ophthalmology & Visual Science, 2012;53(4):1729–33.
  62. Hardarson SH, Elfarsson A, Agnarsson BA, Stefansson E, Retinal oximetry in central retinal artery occlusion, Acta ophthalmologica, 2012.
  63. Furukawa H, Arimoto H, Shirai T, et al., Oximetry of retinal capillaries by multicomponent analysis, Applied spectroscopy 2012;66(8):962–9.
  64. Boeckaert J, Vandewalle E, Stalmans I, Oximetry: recent insights into retinal vasopathies and glaucoma, Bulletin de la Societe belge d’ophtalmologie, 2012;(319):75–83.
  65. Olafsdottir OB, Hardarson SH, Gottfredsdottir MS, et al., Retinal oximetry in primary open-angle glaucoma, Investigative Ophthalmology & Visual Science 2011;52(9):6409–13.
  66. Kim SK, Kim DM, Suh MH, et al., Retinal oximetry based on nonsimultaneous image acquisition using a conventional fundus camera, IEEE Transactions on Medical Imaging, 2011;30(8):1577–80.
  67. Denninghoff KR, Sieluzycka KB, Hendryx JK, et al., Retinal oximeter for the blue-green oximetry technique, Journal of Biomedical Optics,2011;16(10):107004.
  68. Lemaillet P, Ramella-Roman JC, Dynamic eye phantom for retinal oximetry measurements, Journal of Biomedical Optics, 2009;14(6):064008.
  69. Izhaky D, Nelson DA, Burgansky-Eliash Z, Grinvald A, Functional imaging using the retinal function imager: direct imaging of blood velocity, achieving fluorescein angiography-like images without any contrast agent, qualitative oximetry, and functional metabolic signals, Japanese Journal of Ophthalmology, 2009;53(4):345-–51.
  70. Hammer M, Vilser W, Riemer T, Schweitzer D, Retinal vessel oximetry-calibration, compensation for vessel diameter and fundus pigmentation, and reproducibility, Journal of Biomedical Optics, 2008;13(5):054015.
  71. Ben-Zion I, Harris A, Weizman Y, et al., [An updated review of methods for human retinal oximetry measurements and current applications], Harefuah, 2008;147(10):812–7,36.
  72. Narasimha-Iyer H, Beach JM, Khoobehi B, et al., Algorithms for automated oximetry along the retinal vascular tree from dual-wavelength fundus images, Journal of Biomedical Optics, 2005;10(5):054013.
  73. Harris A, Dinn RB, Kagemann L, Rechtman E, A review of methods for human retinal oximetry, Ophthalmic Surgery, Lasers & Imaging: The Official Journal of the International Society for Imaging in the Eye, 2003;34(2):152–64.
  74. Crittin M, Schmidt H, Riva CE, Hemoglobin oxygen saturation (So2) in the human ocular fundus measured by reflectance oximetry: preliminary data in retinal veins, Klinische Monatsblatter fur Augenheilkunde,2002;219(4):289–91.
  75. Smith MH, Optimum wavelength combinations for retinal vessel oximetry, Applied optics,1999;38(1):258–67.
  76. Beach JM, Schwenzer KJ, Srinivas S, et al., Oximetry of retinal vessels by dual-wavelength imaging: calibration and influence of pigmentation, Journal of Applied Physiology, 1999;86(2):748–58.
  77. de Kock JP, Tarassenko L, Glynn CJ, Hill AR, Reflectance pulse oximetry measurements from the retinal fundus, IEEE transactions on bio-medical engineering, 1993;40(8):817–23.
  78. Delori FC, Noninvasive technique for oximetry of blood in retinal vessels, Applied optics,1988;27(6):1113–25.
  79. Roberts DA, Analysis of vessel absorption profiles in retinal oximetry, Medical physics,1987;14(1):124–30.
  80. Cohen AJ, Laing RA, Multiple scattering analysis of retinal blood oximetry, IEEE Transactions on Bio-medical Engineering, 1976;23(5):391–400.
  81. Hammer M, Heller T, Jentsch S, et al., Retinal Vessel Oxygen Saturation under Flicker Light Stimulation in Patients with Nonproliferative Diabetic Retinopathy, Investigative Ophthalmology & Visual Science,2012;53(7):4063–8.
  82. Acton JH, Cubbidge RP, King H, et al., Drusen detection in retromode imaging by a scanning laser ophthalmoscope, Acta ophthalmologica,2011;89(5):e404–11.
  83. Schweitzer D, Metabolic mapping, In: Holz FG SR, ed., Medical Retina-Focus on Retinal Imaging, Berlin, Germany: Springer;2010:106–23.
  84. Schweitzer D, Schenke S, Hammer M, et al., Towards metabolic mapping of the human retina, Microscopy research and technique, 2007;70(5):410–9.
  85. Schweitzer D, Gaillard ER, Dillon J, et al., Time-resolved autofluorescence imaging of human donor retina tissue from donors with significant extramacular drusen, Investigative Ophthalmology & Visual Science, 2012;53(7):3376–86.
  86. Schweitzer D, Hammer M, Schweitzer F, et al., In vivo measurement of time-resolved autofluorescence at the human fundus, Journal of Biomedical Optics, 2004;9(6):1214–22.
  87. Schweitzer D, Quick S, Schenke S, et al., Comparison of parameters of time-resolved autofluorescence between healthy subjects and patients suffering from early AMD, Der Ophthalmologe: Zeitschrift der Deutschen Ophthalmologischen Gesellschaft,2009;106(8):714–22.
  88. Porter J, Adaptive optics for vision science: principles, practices, design, and applications, Hoboken, NJ: Wiley-Interscience; 2006.
  89. Tyson RK, Principles of adaptive optics, 3rd ed. Boca Raton, FL: CRC Press, 2011.
  90. Chen DC, Jones SM, Silva DA, Olivier SS, High-resolution adaptive optics scanning laser ophthalmoscope with dual deformable mirrors, Journal of the Optical Society of America A, Optics, Image Science, and Vision,2007;24(5):1305–12.
  91. Joeres S, Jones SM, Chen DC, et al., Retinal imaging with adaptive optics scanning laser ophthalmoscopy in unexplained central ring scotoma, Archives of Ophthalmology, 2008;126(4):543–7.
  92. Kocaoglu OP, Cense B, Jonnal RS, et al., Imaging retinal nerve fiber bundles using optical coherence tomography with adaptive optics, Vision Research,2011;51(16):1835–44.
  93. Miller DT, Kocaoglu OP, Wang Q, Lee S., Adaptive optics and the eye (super resolution OCT), Eye,2011;25(3):321–30.
  94. Jonnal RS, Kocaoglu OP, Wang Q, et al., Phase-sensitive imaging of the outer retina using optical coherence tomography and adaptive optics, Biomedical Optics Express, 2012;3(1):104–24.
  95. Williams DR, Imaging single cells in the living retina, Vision Research, 2011;51(13):1379–96.
  96. Kilbride PE, Alexander KR, Fishman M, Fishman GA, Human macular pigment assessed by imaging fundus reflectometry, Vision Research, 1989;29(6):663–74.
  97. Berendschot TT, van Norren D, Macular pigment shows ringlike structures, Investigative Ophthalmology & Visual Science, 2006;47(2):709–14.
  98. Mordant DJ, Al-Abboud I, Muyo G, et al., Spectral imaging of the retina, Eye,2011;25(3):309–20.
  99. Bone RA, Brener B, Gibert JC, Macular pigment, photopigments, and melanin: distributions in young subjects determined by four-wavelength reflectometry, Vision Research, 2007;47(26):3259–68.
  100. Preece SJ, Claridge E, Monte Carlo modelling of the spectral reflectance of the human eye, Physics in Medicine and Biology, 2002;47(16):2863-–77.
  101. Claridge E, Preece SJ, An inverse method for the recovery of tissue parameters from colour images. Information processing in medical imaging: proceedings of the conference, 2003;18:306–17.
  102. Preece SJ, Styles IB, Cotton SD, et al., Model-based parameter recovery from uncalibrated optical images, Medical image computing and computer-assisted intervention: MICCAI International Conference on Medical Image Computing and Computer-Assisted Intervention, 2005;8(Pt 2):509–16.
  103. Styles IB, Calcagni A, Claridge E, et al., Quantitative analysis of multi-spectral fundus images, Medical Image Analysis, 2006;10(4):578–97.
  104. Calcagni A, Gibson JM, Styles IB, et al., Multispectral retinal image analysis: a novel non-invasive tool for retinal imaging, Eye, 2011;25(12):1562–9.

Further Resources

Share this Article
Related Content In Imaging
  • Copied to clipboard!
    accredited arrow-down-editablearrow-downarrow_leftarrow-right-bluearrow-right-dark-bluearrow-right-greenarrow-right-greyarrow-right-orangearrow-right-whitearrow-right-bluearrow-up-orangeavatarcalendarchevron-down consultant-pathologist-nurseconsultant-pathologistcrosscrossdownloademailexclaimationfeedbackfiltergraph-arrowinterviewslinkmdt_iconmenumore_dots nurse-consultantpadlock patient-advocate-pathologistpatient-consultantpatientperson pharmacist-nurseplay_buttonplay-colour-tmcplay-colourAsset 1podcastprinter scenerysearch share single-doctor social_facebooksocial_googleplussocial_instagramsocial_linkedin_altsocial_linkedin_altsocial_pinterestlogo-twitter-glyph-32social_youtubeshape-star (1)tick-bluetick-orangetick-red tick-whiteticktimetranscriptup-arrowwebinar Sponsored Department Location NEW TMM Corporate Services Icons-07NEW TMM Corporate Services Icons-08NEW TMM Corporate Services Icons-09NEW TMM Corporate Services Icons-10NEW TMM Corporate Services Icons-11NEW TMM Corporate Services Icons-12Salary £ TMM-Corp-Site-Icons-01TMM-Corp-Site-Icons-02TMM-Corp-Site-Icons-03TMM-Corp-Site-Icons-04TMM-Corp-Site-Icons-05TMM-Corp-Site-Icons-06TMM-Corp-Site-Icons-07TMM-Corp-Site-Icons-08TMM-Corp-Site-Icons-09TMM-Corp-Site-Icons-10TMM-Corp-Site-Icons-11TMM-Corp-Site-Icons-12TMM-Corp-Site-Icons-13TMM-Corp-Site-Icons-14TMM-Corp-Site-Icons-15TMM-Corp-Site-Icons-16TMM-Corp-Site-Icons-17TMM-Corp-Site-Icons-18TMM-Corp-Site-Icons-19TMM-Corp-Site-Icons-20TMM-Corp-Site-Icons-21TMM-Corp-Site-Icons-22TMM-Corp-Site-Icons-23TMM-Corp-Site-Icons-24TMM-Corp-Site-Icons-25TMM-Corp-Site-Icons-26TMM-Corp-Site-Icons-27TMM-Corp-Site-Icons-28TMM-Corp-Site-Icons-29TMM-Corp-Site-Icons-30TMM-Corp-Site-Icons-31TMM-Corp-Site-Icons-32TMM-Corp-Site-Icons-33TMM-Corp-Site-Icons-34TMM-Corp-Site-Icons-35TMM-Corp-Site-Icons-36TMM-Corp-Site-Icons-37TMM-Corp-Site-Icons-38TMM-Corp-Site-Icons-39TMM-Corp-Site-Icons-40TMM-Corp-Site-Icons-41TMM-Corp-Site-Icons-42TMM-Corp-Site-Icons-43TMM-Corp-Site-Icons-44TMM-Corp-Site-Icons-45TMM-Corp-Site-Icons-46TMM-Corp-Site-Icons-47TMM-Corp-Site-Icons-48TMM-Corp-Site-Icons-49TMM-Corp-Site-Icons-50TMM-Corp-Site-Icons-51TMM-Corp-Site-Icons-52TMM-Corp-Site-Icons-53TMM-Corp-Site-Icons-54TMM-Corp-Site-Icons-55TMM-Corp-Site-Icons-56TMM-Corp-Site-Icons-57TMM-Corp-Site-Icons-58TMM-Corp-Site-Icons-59TMM-Corp-Site-Icons-60TMM-Corp-Site-Icons-61TMM-Corp-Site-Icons-62TMM-Corp-Site-Icons-63TMM-Corp-Site-Icons-64TMM-Corp-Site-Icons-65TMM-Corp-Site-Icons-66TMM-Corp-Site-Icons-67TMM-Corp-Site-Icons-68TMM-Corp-Site-Icons-69TMM-Corp-Site-Icons-70TMM-Corp-Site-Icons-71TMM-Corp-Site-Icons-72