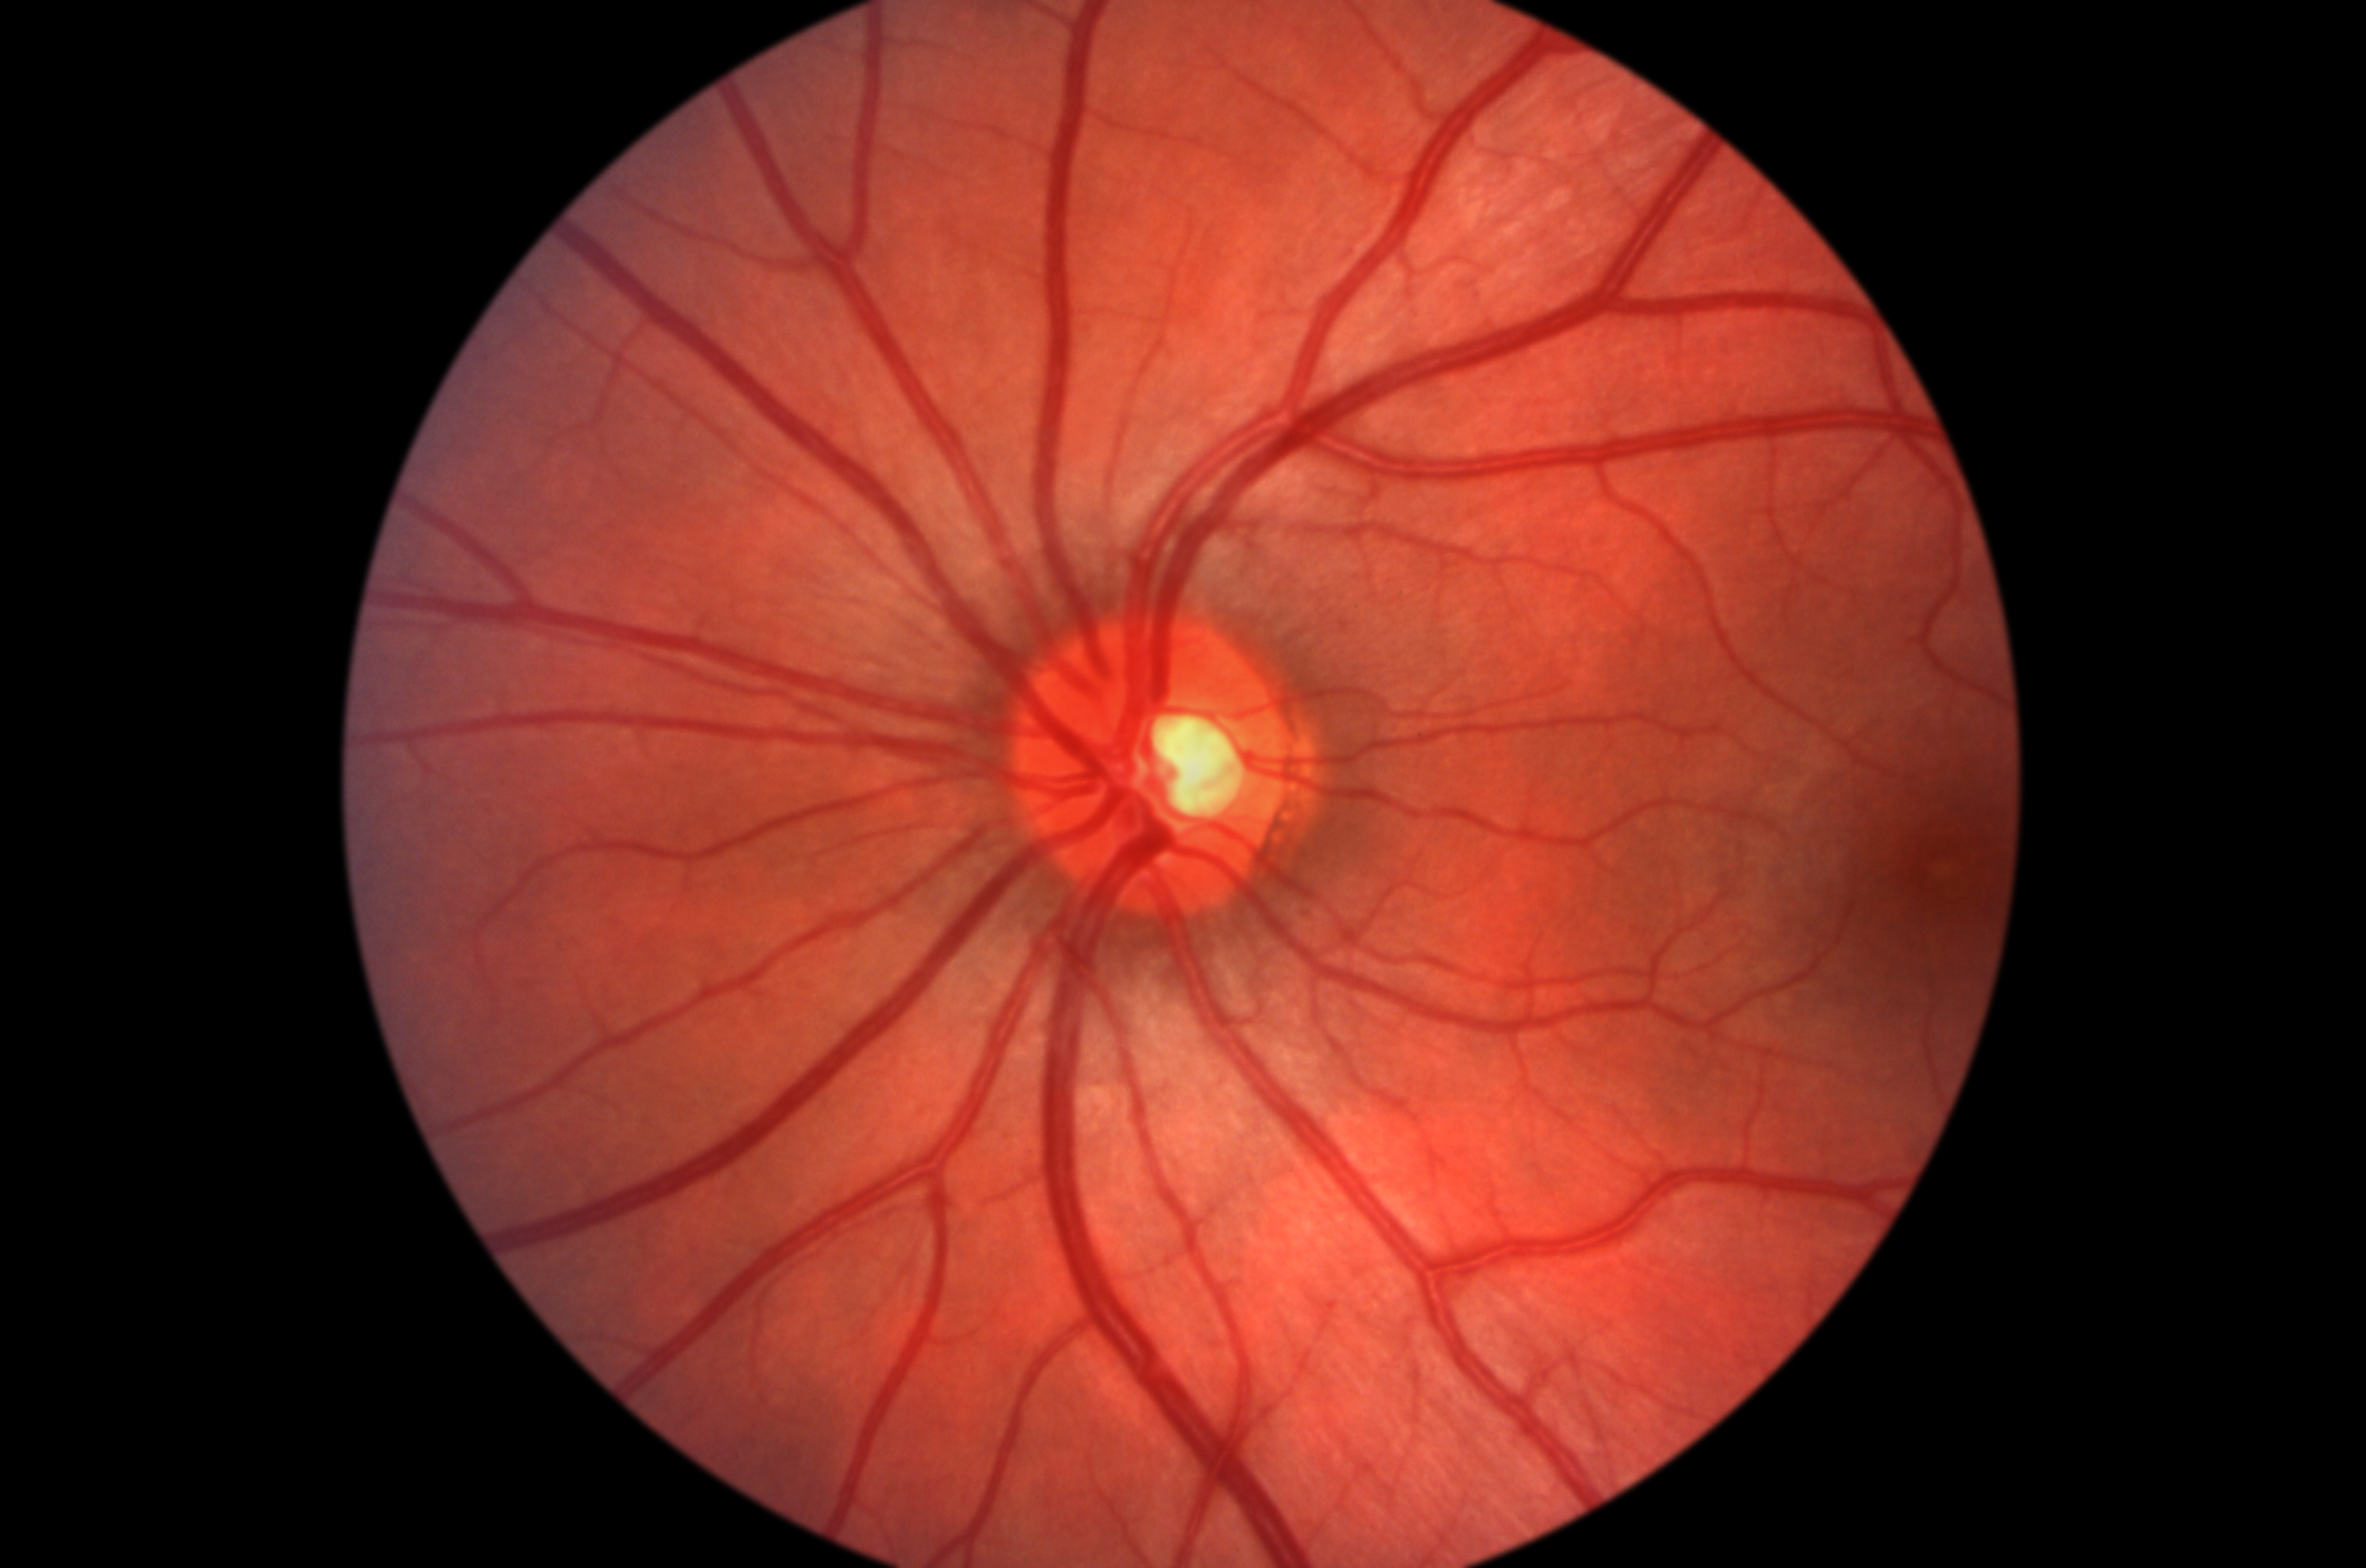
Central serous chorioretinopathy (CSCR) is an idiopathic syndrome of young to middle-aged adults, with men affected more commonly than women. CSCR is characterised by serous detachment of the neurosensory retina with focal and multifocal areas of leakage at the level of the retinal pigment epithelium (RPE) predominantly affecting the macular area. Patients often complain of blurred central vision, image distortion (micropsia) and impaired dark adaptation.1
Recently, this idiopathic syndrome has been associated with systemic corticosteroid therapy.2 In most cases, CSCR resolves spontaneously with good visual prognosis within a few months; however, prolonged and recurrent macular detachment in some cases may cause degenerative changes in subfoveal RPE and neurosensory retina with poor visual outcome.3 The purpose of this article is to objectively assess the evolution of CSCR by multifocal electroretinogram (mf-ERG) recordings at presentation and after the disappearance of ophthalmoscopic and fluoroangiographic evidence of the disease.
Patients and Methods
The study included 21 consecutive cases (21 eyes) with CSCR referred to our departments between December 2000 and November 2003. The mean age of the patients was 43.43 years (range 35–51, standard deviation [SD] 5.44); 18 were males and three were female. Inclusion criteria were no previous episodes of CSCR, unilateral involvement, age less than 55 years and good medical status with no underlying medical problems or drug abuse relevant to CSCR. None of the patients had any other ocular diseases, such as high myopia, diffuse retinal degeneration or cataract, which may influence the mf-ERG recording. CSCR was defined as a serous detachment of the neurosensory retina on fundus biomicroscopy secondary to leakage at the level of RPE on fluorescein angiography.
At presentation, all patients underwent a complete ophthalmic examination, including best corrected visual acuity (VA) assessment (Snellen chart), fundus examination, fluorescein angiography and mf-ERG recording. Patients were prospectively followed up for two to four months until recovery from CSCR. None received laser photocoagulation. Clinical recovery from the disease was defined as the resolution of neurosensory detachment, the disappearance of leakage in fluorescein angiography and the recovery of VA to initial value. Masked evaluators were used to determine initial and final VA. The institutional ethical committee approved this study and a relevant consent form was signed by all patients.
Multifocal Electroretinogram Recording
For the recording of the mf-ERG, the Visual Evoked Response Imaging System III (VERIS III, Tomey, Nagoya, Japan) was used. The stimulus matrix consisted of 61 hexagonal elements displayed on a cathode ray tube (CRT) colour monitor driven at a frame of 75Hz. These hexagons elicit approximately equal signal amplitude at all locations on a normal retina. Each hexagon was independently alternated between black and white at a rate of 75Hz, and the stimulation technique allowed a retinal response from each stimulus. The luminance of the stimulus for white was 200cd/m2 and the contrast was 99.3%. The radius of the stimulus array subtended approximately 20º high and 25º wide. The bandwidth of the amplifier was 10 to 300 Hz (-6bdB/oct), and the amplification was x10,000.
The pupils of the patients were dilated by tropicamide 0.5% and phenylephrine 5%, and the eyes were optically corrected for near vision to clearly see the small fixation spot in the centre of the stimulus matrix. For signal acquisition, a bipolar contact lens was used in which the active and the reference electrodes were incorporated in the contact lens. The ground electrode was attached at the ear lobe. The fellow eye was closed and the duration of the data acquisition was four minutes divided into eight sessions of 30 seconds. The recording procedure was repeated if there were spurious potentials from eye blinks or if ocular movement was recorded. Also, mf-ERG was recorded twice in an interval of 24 hours by two masked evaluators.
The response density (amplitude per unit retinal area [nV/deg2]) of each local response was estimated as the dot product between the normalised response template and each local response. The normal ranges for these amplitudes were defined by calculation of the median and the 95% confidence intervals (CIs) in one eye of 33 normal volunteers between 35 and 50 years of age (mean age 38.8 years). The mf-ERG stimuli location and anatomical areas corresponded roughly as follows: ring 1 to the fovea, ring 2 to the parafovea, ring 3 to the perifovea, ring 4 to the near periphery and ring 5 to the central part of the middle periphery. The amplitude of each group was scaled to reflect the angular size of the stimulus hexagon that produces the response. These averages give a more accurate view of the relative response densities of each group. The average retinal response density of the retinal area corresponding to ring 1 (fovea) is approximately 22.97nV/deg2, to ring 2 (parafovea) is 12.17nV/deg2, to ring 3 (perifovea) is 11.8nV/deg2, to ring 4 (near periphery) is 10nV/deg2 and to ring 5 is roughly 10nV/deg2. The retinal response density decreases with eccentricity, although there is no further decrease from ring 4 to ring 5.
Statistical Analysis
The paired t-test was used to study the significance of test–re-test differences. If the pairing was not effective or the distribution did not pertain to Gaussian parameters, the Mann-Whitney non-parametric test was used. Furthermore, the Mann-Whitney test was used to compare the mean differences of the tests with the sample of 33 normal individuals of similar age.
Results
At presentation in all patients, the best corrected VA of the affected eyes ranged from 0.2 to 1.0 (standard Snellen chart) (see Table 1). The mean VA was 0.595 (SD 0.216). After the resolution of CSCR, the best corrected VA of the affected eyes ranged from 0.6 to 1.0. The meanVA was 0.767 (SD 0.139).
Multifocal Electroretinogram Results
The results of the MF-ERG are summarised in Table 1. At presentation, the average mean retinal response density in area 1, which represents the foveal area, was 11.29nV/deg2 (range 6.01–16.8nV/deg2, SD 3.14). The mean value is 50.8% compared lower with normal controls (mean 22.97nV/deg2, SD 3.6). In area 2, representing the perifoveal area, the average mean retinal response density was 7.64nV/deg2 (SD 3.21). This value is 37.2% lower compared with normal controls (mean 12.18nV/deg2, SD 2.27) (see Figure 1).
After recovery from CSCR, an improvement of the mean retinal response density was noted (see Figure 2). The average mean retinal response density of area 1 was improved to 16.05nV/deg2 (SD 3.87), still 30.1% lower compared with the normal controls. In area 2, the average mean retinal response density of the affected eyes was also increased to 9.27nV/deg2 (SD 3.25); lower by 23.9% to normal controls. Both differences are statistically significant (p<0.001). The correlations between VA and mf-ERG values of affected eyes were calculated, and the only correlation found was between VA after resolution and VA at presentation (R=0.70) and between mf-ERG after resolution and mf-ERG at presentation (R=0.82). It is interesting that in six of 21 fellow non-affected eyes the mf-ERG values were pathological. The mf-ERG average mean retinal response density in areas 1 and 2 was 12 and 7.86nV/deg2, respectively (see Table 2). For the remaining 15 eyes, the mf-ERG averaged mean retinal response density in areas 1 and 2 was 19.7nV/deg2 and 12.3nV/deg2, respectively (see Figure 3 and Table 3).
Discussion
mf-ERG helps us to evaluate the functional component of the macular area, especially in the absence of macular findings. However, in our study no correlation between the mf-ERG findings and the best corrected VA was observed. This finding could be attributed to the fact that the retinal response densities in areas 1 and 2 reflect not only the integrity of the photoreceptors of the fovea, which are few and responsible for the VA, but also the electrical responses of the bipolar and the Müller cells of the inner layers of the parafoveal area. At presentation, the mean retinal response densities of mf-ERG in areas 1 and 2 of the affected eyes are decreased. After recovery, the mf-ERG amplitudes slightly increase, but still remain significantly lower than normal. These findings imply a functional recovery of the central retinal area. However, a degree of functional impairment persists in spite of the absorption of subretinal fluid. This is not surprising as various stress factors or systemic causes that affect CSCR patients are likely to persist even after the attack.5 Also, our findings show that at presentation in some cases the mf-ERG of the fellow non-affected eye is abnormal compared with normal subjects, and this abnormality persists especially in area 1 after the clinical recovery. The latter does not concur with the findings of Vajaranant et al.,6 who concluded that the elecroretinographic changes are limited in the affected eye.
The findings of diffuse bilateral macular dysfunction in CSCR is consistent with the concept that this disease is conditioned by systemic humoral factors such as adrenaline and corticosteroids or by diffuse underlying choroidal vascular disease.7 The findings of our study support this view.